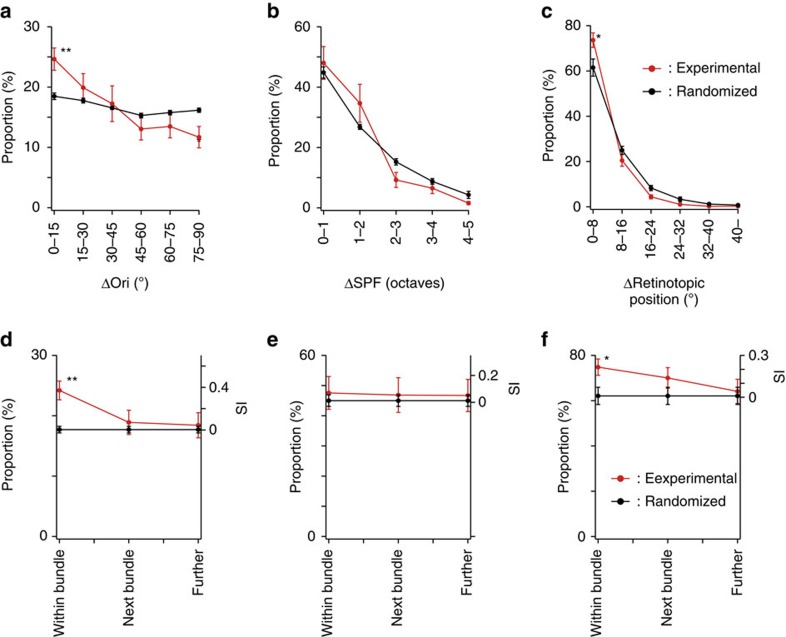
Figure 7. Proportion of dendrites with similar response properties within a dendritic bundle.
(a–c) The proportion of dendrites is plotted as a function of Δori (a), ΔSPF (b) and Δretinotopic position (c) between dendrite pairs within a dendritic bundle after eliminating the duplicated counts of branched dendrites. (d–f) The proportion of similarly tuned dendrite pairs is plotted for dendrite pairs within the same bundle, between neighbouring bundles and between bundles further apart. The similarly tuned dendrite pairs are defined by Δori<15° for orientation (d), ΔSPF<1 octave for SPF (e) and Δretinotopic position<8° for retinotopic positions (f). **P<0.01 and *P<0.05. Red: experimental data; black: randomized data.

