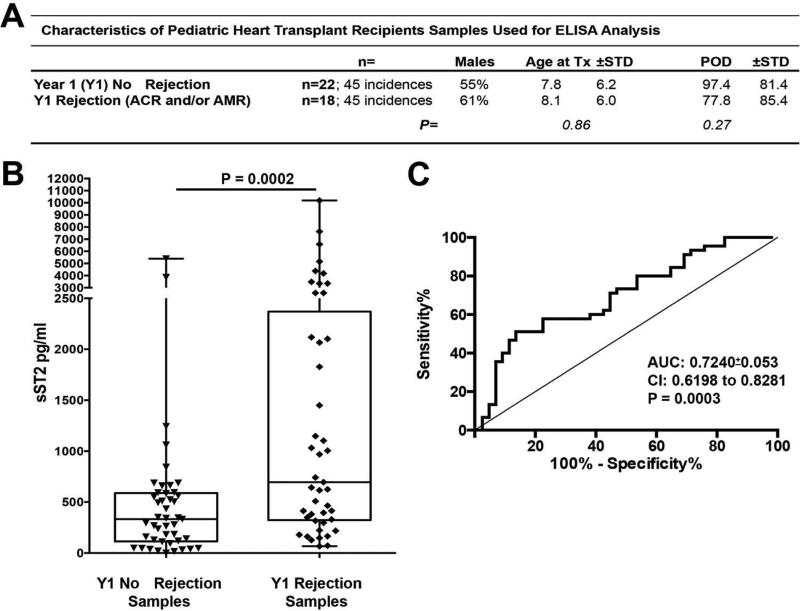
Figure 2. Elevated serum sST2 distinguishes pediatric HTx recipients suffering rejection episodes.
Year 1 (Y1) HTx recipient serum sST2 ELISA measures at time points of pathologist-diagnosed rejection (Y1 Rejection Samples; ACR Grade ≥2R and/or histological evidence for pathological AMR (AMR) and C4d+) were compared to time points where the recipient was classified as rejection-free (Y1 No Rejection Samples; ACR and AMR Grade=0 and C4d-). (A) Table depicts the demographics for the two groups. (B) ELISA values are presented as box whisker plots as in Fig. 1 and indicated significance levels calculated through a Wilcoxon-Mann-Whitney rank sum test comparison. (C) Receiver-operator characteristic (ROC) curve analysis of Y1 No Rejection Samples (Negative Control Group) and Y1 Rejection Samples (Positive Control Group). ACR, acute cellular rejection; AMR, antibody-mediated rejection; HTx, heart transplant.

