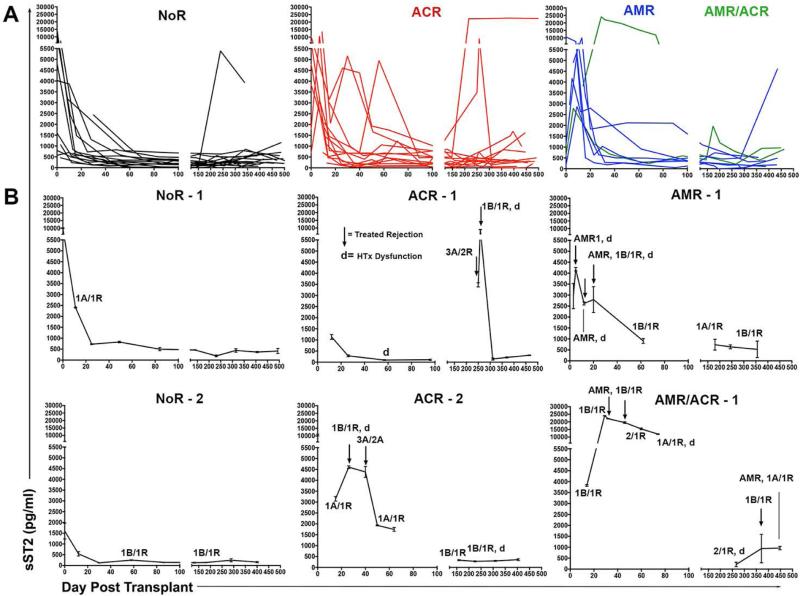
Figure 3. Serum sST2 is increased during HTx rejection and decreases following recipient treatment.
Circulating sST2 was assessed by ELISA in HTx recipient serum samples obtained serially in the first year post-transplant. (A) Changes of sST2 concentrations are depicted for all patients grouped into cohorts based on Year 1 (Y1) outcomes. Groups include patients suffering one or more episodes of diagnosed ACR (Grade≥2R) and/or histologically and C4d+ indicated pathogenic AMR, or those remaining free from ACR or AMR during Y1 (No Rejection; NoR). (B) Panels depict individual recipients representative of the indicated group. Black arrows indicate times of recipient treatment for rejection; d = points of graft dysfunction; All EMB grades over 0 indicated at appropriate time point. ACR, acute cellular rejection; AMR, antibody-mediated rejection; HTx, heart transplant; sST2, soluble ST2.

