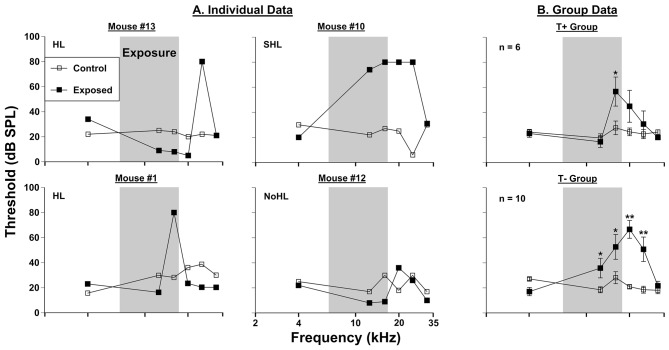
Figure 2.
Auditory thresholds assessed via prepulse inhibition (PPI) audiometry. (A) Four individual mice were tested before (control) and 3 months (exposed 3M) after sound exposure. (B) Group PPI data for T+ mice (n = 6) and T− mice (n = 10; from Figure 1B), in the same conditions as (A). The narrow band exposure stimulus is represented by a gray box. Each animal was classified as having hearing loss (HL), severe hearing loss (SHL), or no hearing loss (NoHL) based on the number of frequencies at which PPI thresholds were elevated. Significant threshold shifts indicated with (*) at p = 0.05 level or (**) at p = 0.001 level.

