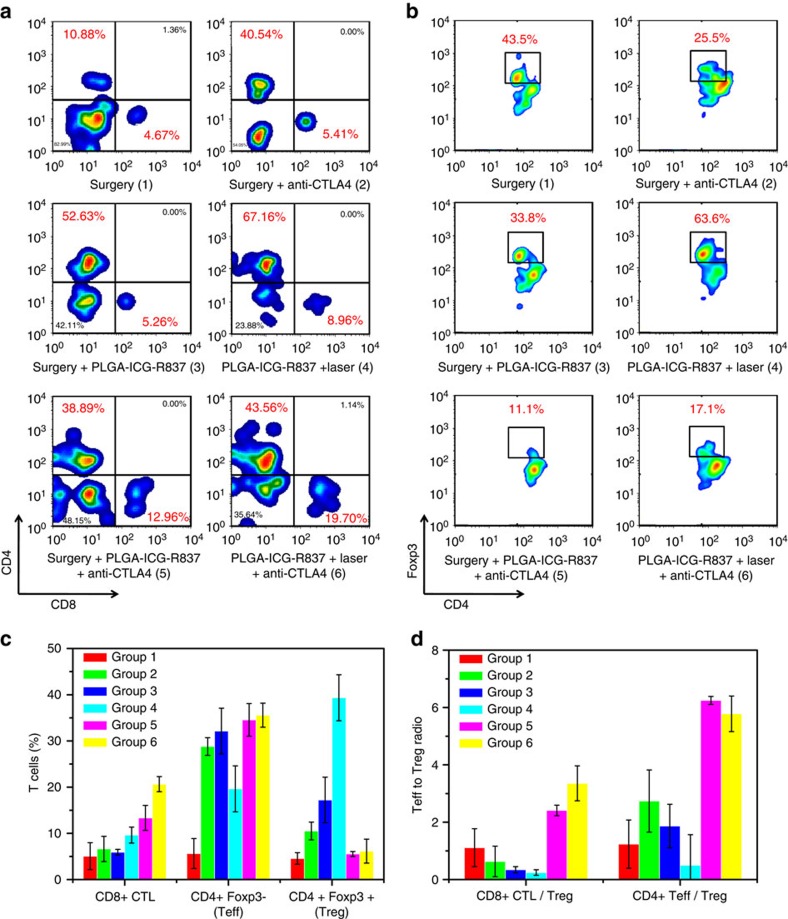
Figure 4. The mechanism study.
(a) Representative flow cytometry plots showing different groups of T cells in secondary tumours. Tumour cell suspensions were analysed by flow cytometry for T-cell infiltration (gated on CD3+ T cells). (b) Representative flow cytometry plots showing percentages (gated on CD4+cells) of CD4+FoxP3+T cells in secondary tumours after various treatments indicated. (c) Proportions of tumour-infiltrating CD8+ killer T cells, CD4+ FoxP3- effector T cells and CD4+ FoxP3+ regulatory T cells according to data in a and b. (d) CD8+ CTL: Treg ratios and CD4+ effector T cells: Treg ratios in the secondary tumours upon various treatments to remove the first tumours. Both ratios were significantly enhanced after combination treatment with PLGA-ICG-R837-based PTT and anti-CTLA4 therapy. Three mice were measured in each group in a–d. Data are presented as the mean±s.e.m. Error bars are based on triplicated experiments.

