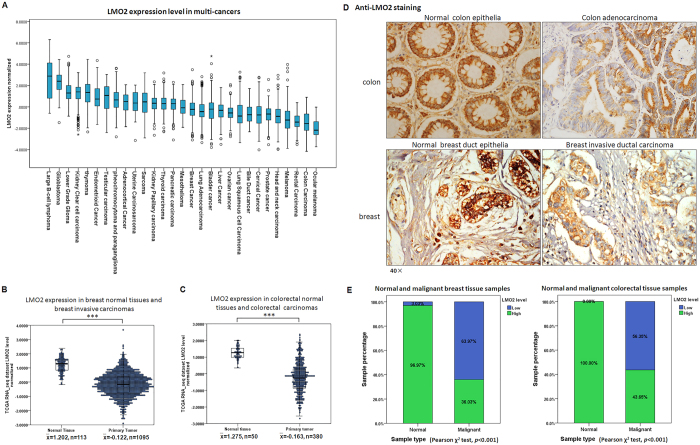
Figure 1. LMO2 expression is reduced in various tumors, including breast and colorectal cancers.
(A) A box plot showing the medians and ranges of normalized LMO2 mRNA levels in multiple tumors from the TCGA Pan-cancer dataset. The small circles represent the outliers. (B) A two-dimensional scatter plot along with box plot showing the medians and distribution of LMO2 mRNA levels in normal breast tissue and primary malignant breast tumors in the TCGA breast invasive carcinoma RNA_seq dataset (n = 1208). The means of the relative LMO2 mRNA level ( ) and sample counts are marked in the plot. ***p < 0.001 (Student’s t-test). (C) A two-dimensional scatter plot and a box plot showing the medians and distribution of LMO2 mRNA levels in normal colorectal tissues and primary malignant colorectal tumors from the TCGA colorectal carcinoma RNA_seq dataset (n = 430). The mean relative LMO2 mRNA level (
 ) and sample counts are marked in the plot. ***p < 0.001 (Student’s t-test). (D) Representative images of LMO2 immunohistochemistry from normal breast tissue, primary breast invasive ductal carcinoma, normal colon tissue, and primary colon adenocarcinoma from clinical patient sample sets. Predominantly cytosolic LMO2 staining was observed in most tissues. (E) A stacked bar plot showing the distribution of LMO2 expression in normal tissues and primary malignant tumors in 169 breast tissue samples and 140 colorectal tissue samples. The sample count percentage in each group and Pearson χ2 test p-values are marked in the plots.

