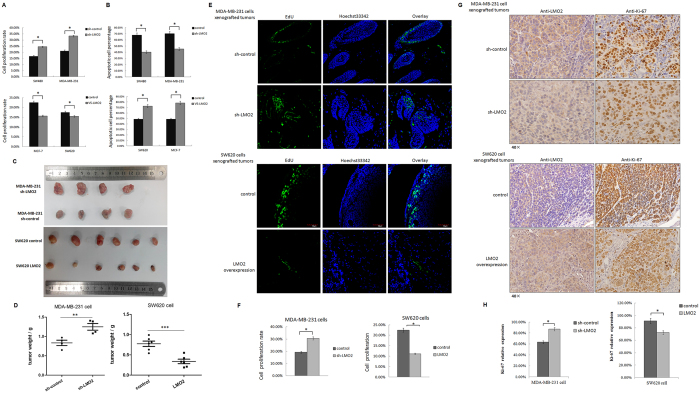
Figure 2. LMO2 inhibits cell proliferation and increases cisplatin-induced apoptosis in breast and colorectal cancers.
(A) Bar plots indicating the percentage of proliferating cells (EdU-positive/Hoechst 33342-positive cell counts) in the indicated cell lines. The means were calculated using a CytationTM 3 system from three independent experiments. *p < 0.05 (Student’s t-test). (B) Bar plots indicating the percentage of apoptotic cells after treatment with 1 μg/ml cisplatin (EdU-positive/Hoechst 33342-positive cell counts) in the indicated cell lines. The mean values were calculated using the CytationTM 3 system from three independent experiments. *p < 0.05 (Student’s t-test). (C) Images of xenograft tumors derived from sh-LMO2/sh-control MDA-MB-231 or LMO2 overexpressing/control SW620 cells. (D) Scatter plots showing the weight of the xenograft tumors shown in (C). **p = 0.0096, ***p = 0.0005 (Student’s t-test). (E) Representative in vivo EdU incorporation assay results from xenograft tumors derived from sh-LMO2/sh-control MDA-MB-231 or LMO2 overexpressing/control SW620 cells. The EdU-positive cells were stained with Fluor-488 and the nuclei were stained with Hoechst 33342. (F) Quantification of in vivo EdU incorporation assays. The bar plots represent the mean percentage of EdU-positive/Hoechst 33342-positive cell counts of nine independent images of relevant tumors. Images were captured and calculations were made using a CytationTM 3 system. *p < 0.05 (Student’s t-test). (G) Images of anti-LMO2 and anti-Ki-67 immunohistochemical staining in consecutive sections of xenograft tumors derived from sh-LMO2/sh-control MDA-MB-231 cells or LMO2 overexpressing/control SW620 cells. (H) Bar plots showing the mean percentage of Ki-67-positive cells. The percentages were calculated as the Ki-67-positive/total tumor cell counts from four visual fields for each sample and four or six samples per group. *p < 0.05 (Student’s t-test).

