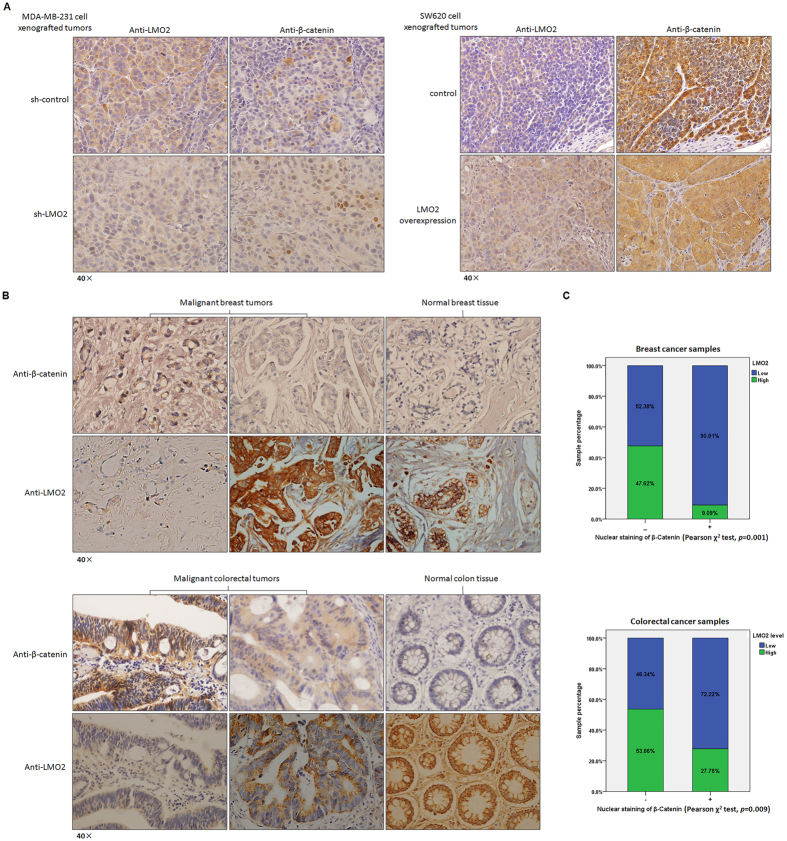
Figure 5. The expression of LMO2 and β-catenin are negatively correlated in SCID mouse xenograft tumors and clinical patient samples.
(A) Representative immunohistochemical staining of LMO2 and β-catenin in consecutive sections of xenograft tumors derived from sh-LMO2/sh-control MDA-MB-231 cells or LMO2 overexpressing/control SW620 cells. A negative correlation between LMO2 expression and the nuclear localization of β-catenin was revealed. (B) Representative immunohistochemical staining of LMO2 and β-catenin in consecutive sections from primary malignant breast/colorectal tumors or normal breast/colon tissues. A negative correlation between LMO2 levels and the nuclear localization of β-catenin was revealed. (C) Stacked bar plots showing the distribution of LMO2 expression in nuclear β-catenin-positive or -negative samples among 136 breast tumor and 118 colorectal tumor samples. The sample count percentage in each group and the p-values calculated using Pearson’s χ2 tests are shown.

