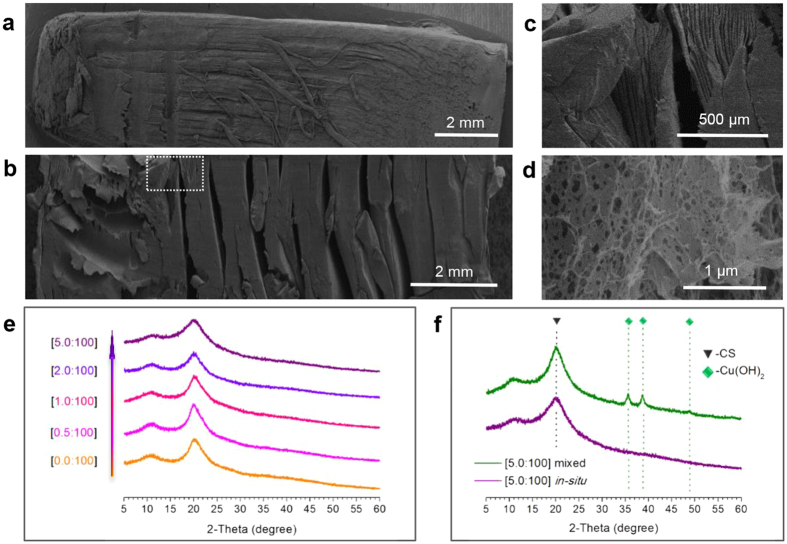
Figure 2. Microscopic structure of copper-CS hydrogel.
(a) SEM image of freeze-dried CS hydrogel sample; (b–d) SEM images of freeze-dried copper-CS hydrogel samples, (c) corresponds to the marked area in (b), n(Cu2+)/n(-NH2) = 5.0:100; (e) XRD profiles of copper-CS samples with different molar ratios of Cu2+ and amino group; (f) XRD profiles of copper-CS sample prepared by in-situ precipitation and Cu(OH)2-CS sample prepared by mixing, n(Cu)/n(-NH2) = 5.0:100.

