
Figure 2. Cd uptake rates in the diatom T. weissflogii as a function of the constant free Cd ion concentrations ([Cd2+]).
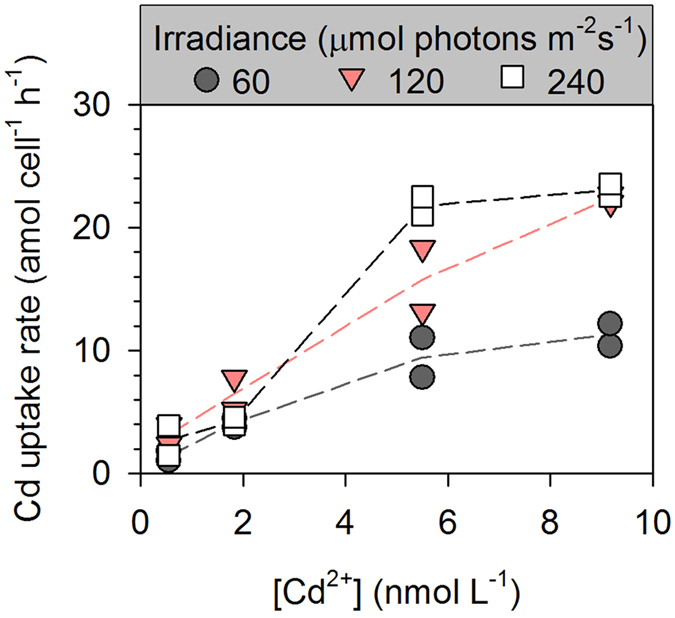
The uptake rate was calculated from the slope of the linear relationship between the intracellular Cd concentration and the exposure time. Each dot is one replicate (n = 2), solid lines represent the trends of their mean values.