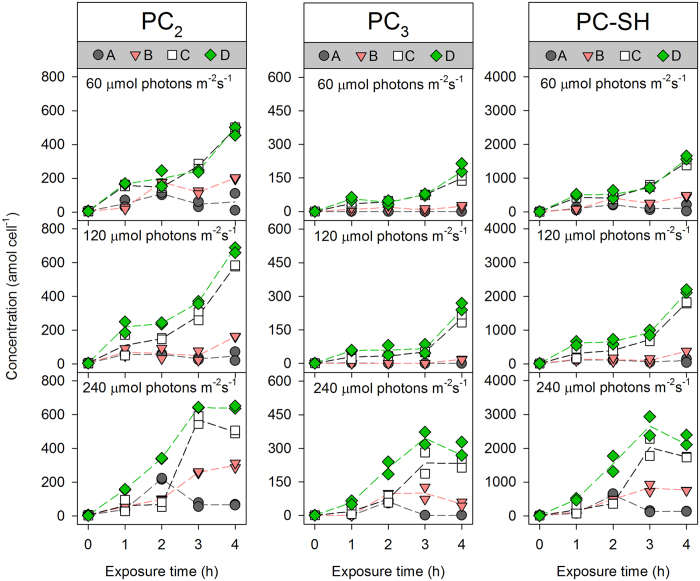
Figure 4. Kinetics of phytochelatin induction (PC2: left; PC3: middle; PC-SH = 2 × PC2 + 3 × PC3 + 4 × PC4: right) in T. weissflogii maintained at different irradiance levels.
The constant free Cd ion concentrations ([Cd2+]) in treatments (A–D) were 5.49 × 10⁻¹⁰, 1.83 × 10⁻⁹, 5.50 × 10⁻⁹, and 9.17 × 10⁻⁹ mol L−1, respectively. Each dot is one replicate (n = 2), solid lines represent the trends of their mean values.

