
Figure 5. Phytochelatin induction rates (PC-SH = 2 × PC2 + 3 × PC3 + 4 × PC4) in the diatom T. weissflogii as a function of the constant free Cd ion concentrations ([Cd2+]).
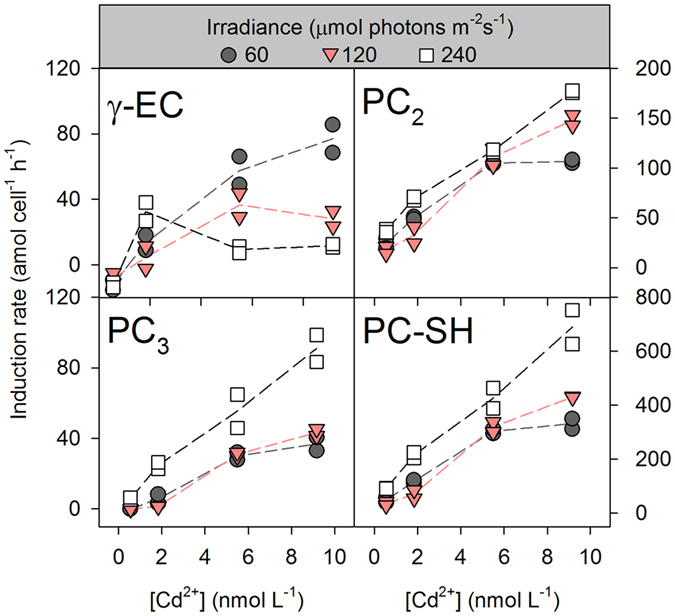
The induction rate was calculated as the time-weighted average of the concentration of intracellular thiols with exposure time. Each dot is one replicate (n = 2), solid lines represent the trends of their mean values.