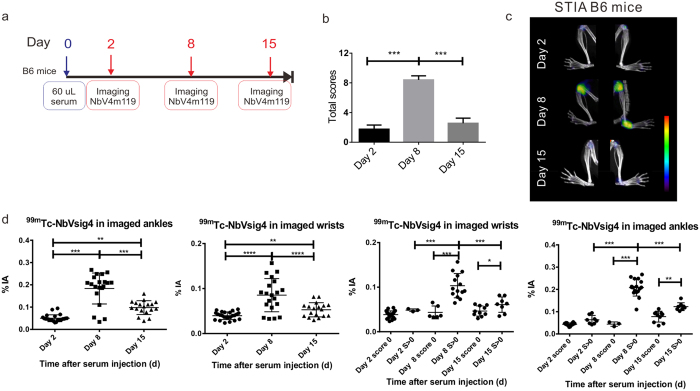
Figure 3. In vivo SPECT/CT imaging with an anti-CRIg tracer for monitoring arthritis recovery in STIA C57BL/6J mice.
(a) Experimental timelines for 12 WT mice injected with KBxN serum and imaged at day 2, day 8 and day 15 post serum transfer. Imaging = SPECT/μCT imaging. (b) The clinical arthritic scores (additive scores for all 4 paws of each mouse, expressed as group mean ± SEM) were measured at day 2, day 8 and day 15 after immunization. (c) Representative SPECT/μCT image of ankles in STIA serum transfer arthritis mice, 3 h post injection with 99mTc-labeled NbV4m119. The same arthritic mice displaying symptoms of arthritis showed specific uptake of 99mTc-labeled NbV4m119 in inflamed joints on day 2, day 8 and day 15 post serum injection. Clinical scores are indicated next to each joint. Representative images of 1 out of 12 mice per group are shown using National Institutes of Health color scale and are scaled to maximum in whole image. (d) Uptake of 99mTc-NbV4m119 in individual wrists and ankles of mice. The % of injected activity (%IA) was quantified for the wrist area. score 0: the wrists with score 0; S > 0: the wrists with arthritis score 1, 2 or 3. The % of injected activity (%IA) was quantified for the ankle area. (mean ± SEM, *P < 0.05, **P < 0.01, *** P< 0.001, ns: not significant).

