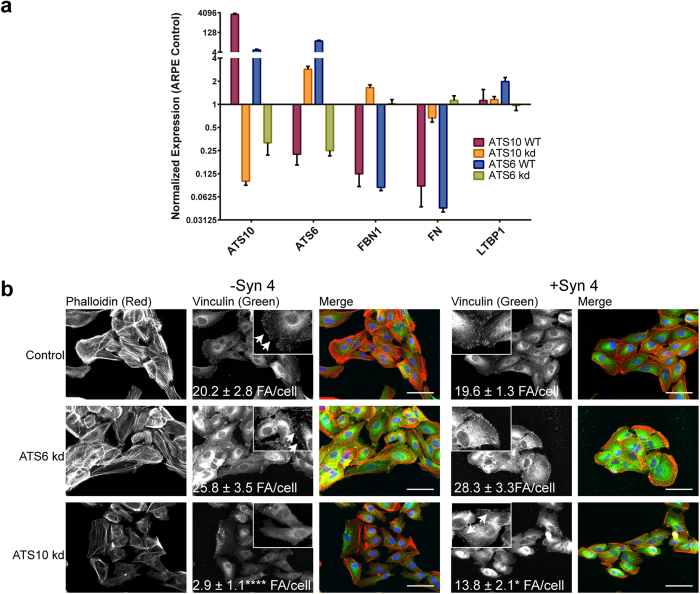
Figure 2. ADAMTS6 and ADAMTS10 can regulate the gene expression of each other.
(a) RT-qPCR analysis of gene expression for ADAMTS10 and ADAMTS6 overexpression (ATS10 WT and ATS6 WT) and knock-down (kd) in ARPE-19A cells. Relative expression normalized to control cells is shown, and was calculated using Bio-Rad CFX Manager V3.1. Normalized expression is plotted on a Log2 scale (n = 3 for both biological and technical replicates). (b) Immunofluorescence microscopy of ARPE-19A cells with siRNA treatment of ADAMTS10 (ATS10 kd) or ADAMTS6 (ATS6 kd). ATS6 kd cells had more focal adhesions than control cells; ATS10 kd cells had significantly fewer focal adhesions than control cells. Transfection with full-length syndecan-4 (+Syn 4) induced focal adhesions in ATS10 kd cells. Statistical significance for deviation from the control values was calculated using 1-way ANOVA with a Bonferroni’s multiple comparisons test using GraphPad Prism V6. Asterisk indicate P values where ****P ≤ 0.0001 (n > 8).

