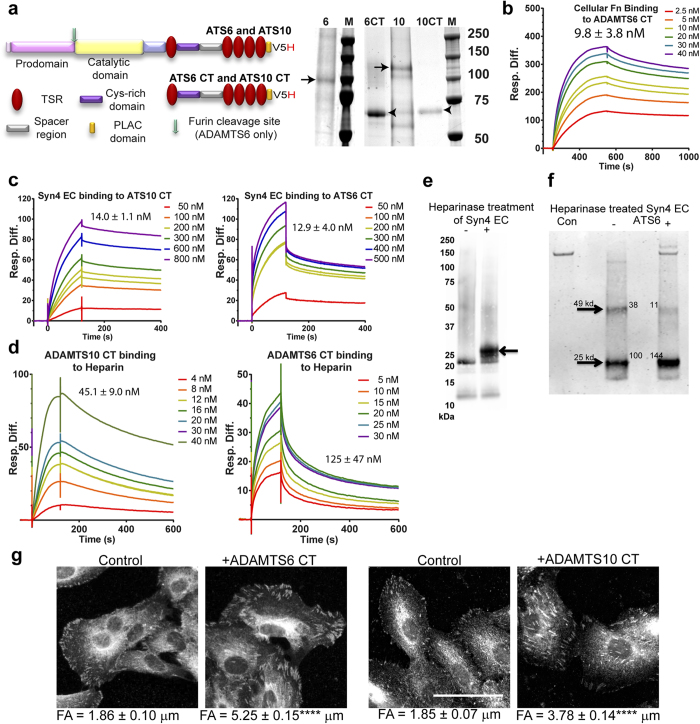
Figure 4. ADAMTS10 and ADAMTS6 interactions with syndecan-4 and modification of focal adhesions.
(a) Coomassie-stained SDS-PAGE showing purified recombinant full-length ADAMTS6 and ADAMTS10, expressed using the 293-EBNA system16. ADAMTS6 was ~100 kDa and ADAMTS10 was ~140 kDa (arrows). The C-terminal regions of ADAMTS6 (6CT) and ADAMTS10 (10CT) were also expressed (arrowheads). Equal amounts of protein were loaded on the gel, however expression levels of the full-length proteins were lower than the C-terminal fragments. Domain structures of full-length molecules and the ADAMTS6 and ADAMTS10 C-terminal region are shown. For purification and detection purposes, all proteins had a C-terminal V5 and His6 tag added (V5H). (b–d) Binding was analysed using Surface Plasmon Resonance, and the response difference (Resp. Diff.) for each experiment was plotted against time (s) (b) Biacore sensorgram showing that cellular FN (Sigma #F2518; isolated from human foreskin fibroblasts) binds to the C-terminal region of ADAMTS6. Resp. Diff. is the ADAMTS6-immobilized flow cell minus the control flow cell. The binding constant (KD) indicated and was calculated using 1:1 Langmuir model. (c) Biacore sensorgrams showing that ADAMTS10 CT and ADAMTS6 CT bind the ecto-domain of syndecan 4. Resp. Diff. is the syndecan-immobilized flow cell minus the control flow cell. The KD for each interaction is shown. (d) Biacore sensorgrams showing that ADAMTS10 CT and ADAMTS6 CT bind heparin. Resp. Diff. is the heparin-immobilized flow cell minus the control flow cell. The KD for each interaction is shown. (e) Recombinant syndecan-4 ectodomain was treated with heparinases I, II and III (indicated +) and analysed by SDS-PAGE and western blotting using anti-syndecan-4 antibody. (f) Heparinase-treated syndecan-4 ectodomain incubated with full-length recombinant ADAMTS6 (ATS6) overnight at 37 °C. (g) Control ARPE-19A cells ± supplementation with purified recombinant C-terminal regions of ADAMTS6, and ADAMTS10 (10 nM) showing focal adhesions (FA) (vinculin stained, B/W). Focal adhesions (FA) lengths were calculated by manually using ImageJ. Adhesions were significantly longer and more prominent in the presence of the C-terminal ADAMTS6 and ADAMTS10 fragment. Statistical significance for deviation from the control values was calculated using 1-way ANOVA with a Bonferroni’s multiple comparisons test using GraphPad Prism V6. Asterisk indicate P values where ****P ≤0.0001. Scale bar indicates 50 μm.

