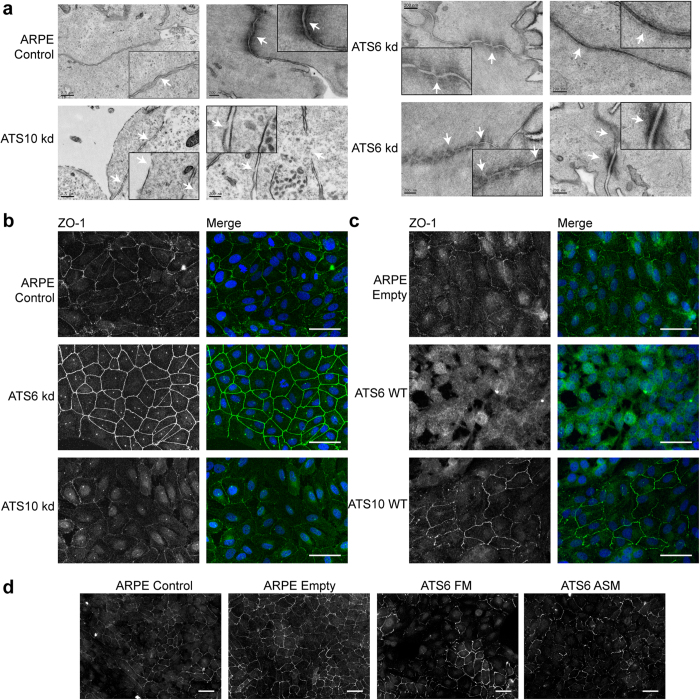
Figure 5. Epithelial cell-cell junctions, and effects of ADAMTS siRNA.
(a) Electron micrography of ARPE-19A cells cultured for 2 days; cell junctions are indicated with white arrows. The scale bars indicate 0.5 μm (1st column) or 200 nm. Control ARPE-19A cells had few tight junctions but some adherens junctions. ADAMTS10 siRNA cultures had disrupted membranes and no tight junctions. ADAMTS6 siRNA cultures had numerous tight, adherens and desmosome junctions. (b–d) Immunofluorescence microscopy of ARPE-19A cultured on glass coverslips for 4 days. (b) Cells were treated with siRNAs to down-regulate ADAMTS6 (ATS6 kd) or ADAMTS10 (ATS10 kd). (c) Cells with lentivector overexpression of ADAMTS10 (ATS10 WT) or ADAMTS6 (ATS6 WT). After fixation, cells were stained for ZO-1 (B/W, green), and nuclei were visualized with DAPI (blue). Images were taken with a 40x objective. Scale bar indicates 50 μm. (d) Cells with lentivector overexpression of ADAMTS6 mutants (ATS6 FM and ATS6 ASM). After fixation, cells were stained for ZO-1. Images were taken with a 20x objective. Scale bar indicates 50 μm.

