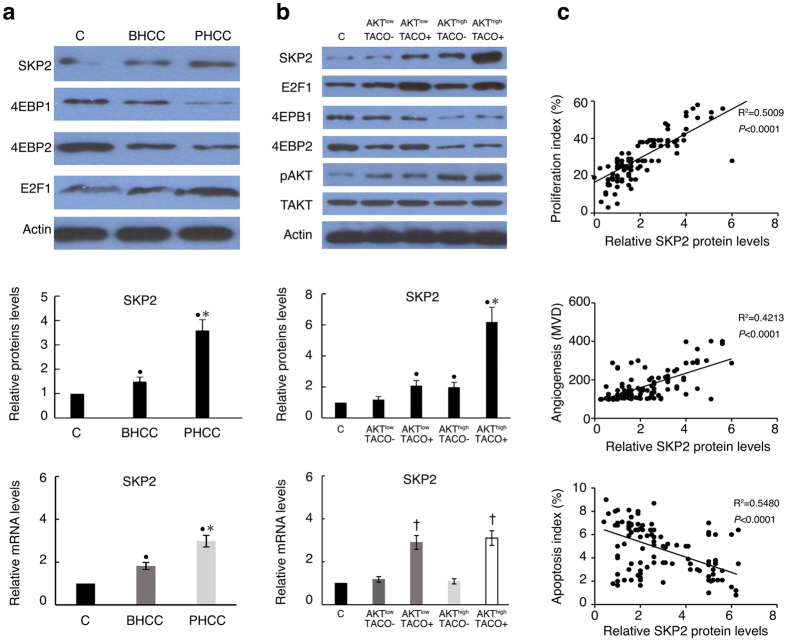
Figure 5. Effect of AKT and TACO on the levels of SKP2 via independent pathways.
(a) Representative Western blot analysis of SKP2, transcription factor E2F1 and translation inhibitor 4EBP1/2 (upper), relative protein (middle) and mRNA levels (lower) of SKP2, in the BHCC and PHCC subgroups as well as paracancerous tissues, which served as a control. •P < 0.05: compared with control. *P < 0.05: PHCC vs. BHCC. (b) Above protein expressing by Western blot analysis (upper), relative protein (middle) and mRNA levels (lower) in HCC with different levels of AKT expression and HBV CP status. •P < 0.05: compared with control. *P < 0.05: HCC with TACO+/AKThigh vs. TACO−/AKTlow or TACO+/AKTlow or TACO−/AKThigh. †P < 0.05: HCC with TACO+ vs. TACO− or control. (c) Correlation of SKP2 protein levels with proliferation index, angiogenesis (MVD), and apoptosis index in 114 human HBV-associated HCC cases. Protein expression quantified by densitometry was shown as a relative value compared to the control. All controls were normalized as 1.

