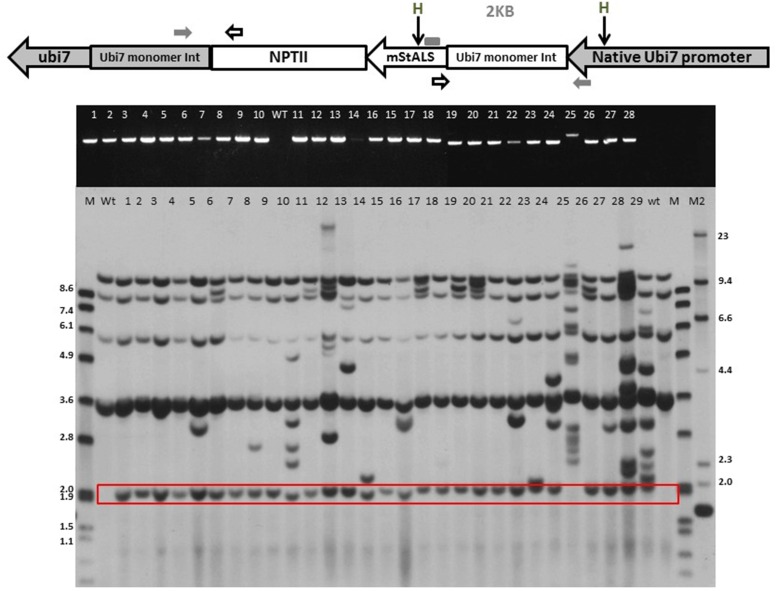
FIGURE 5.
Identification of targeted integration events. DNA from herbicide resistant transgenic lines were isolated for PCR and Southern analyses. (Top panel) Schematic of the Ubi7 locus after site-specific gene integration. Primers 1: within the endogenous Ubi7 promoter and 2: within the mStALS gene coding region are indicated by arrows. Two HindIII restriction enzyme sites, one in the endogenous Ubi7 promoter and one in the mStALS coding region are also labeled. (Middle panel): PCR using primers 1 and 2 detects site-specific integration events. (Bottom panel): Southern blot using StALS probe detects the site-specific integration band at predicted size (boxed). The size of dig-labeled ladders were marked as kb (M: Dig-labeled marker 7, M2: Dig-labeled marker 2).

