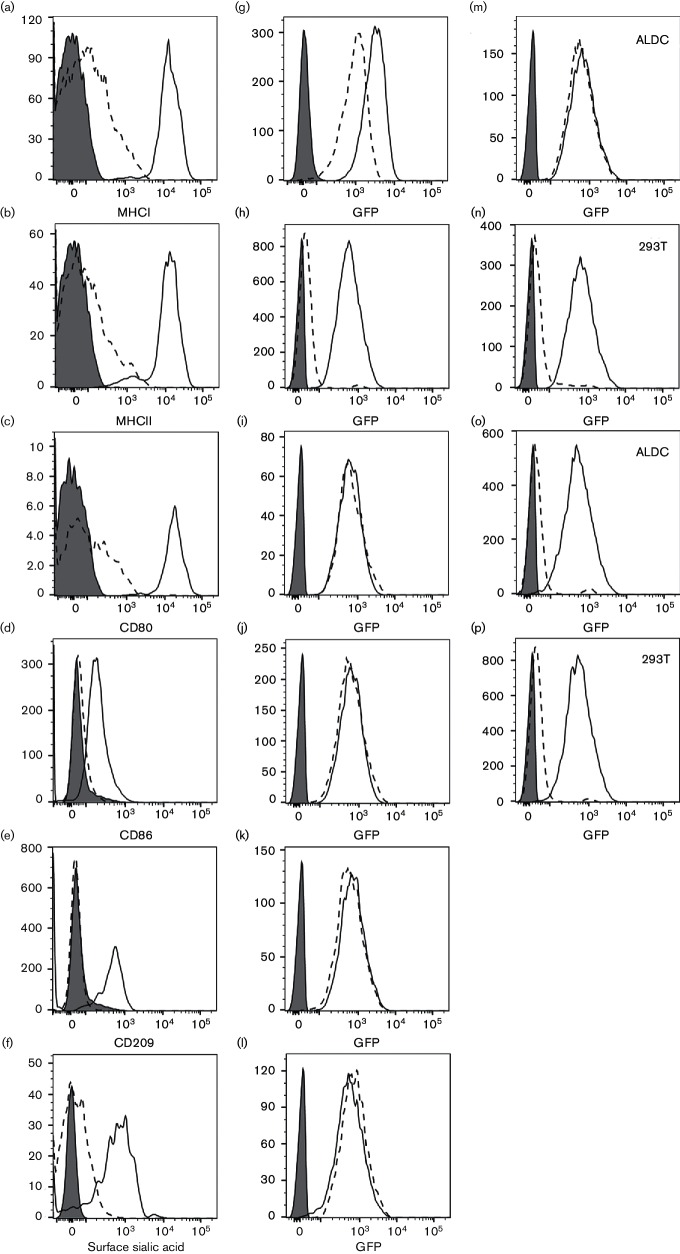
Fig. 2.
Transduction of ALDC by AdV5-GFP following removal of putative receptors from the cell surface. (a–f) Expression of putative AdV5 receptors on ALDC 24 h after treatment (dotted histograms) or mock treatment (solid histograms); grey-filled histograms: isotype controls. (g–l) Expression of GFP in AdV5-GFP-transduced untreated (solid histograms) or treated (dotted histograms) ALDC or in mock-transduced ALDC (grey-filled histograms). (m and n) Expression of GFP in AdV5-GFP-transduced ALDC and 293 cells in the presence of the RGD antagonist Cyclo(Ala-Arg-Gly-Asp-3-Aminomethylbenzoyl) (dotted histogram) or control peptide (solid histogram); grey-filled histogram: mock-transduced cells. (o and p) Expression of GFP in AdV5-GFP-transduced ALDC and 293 in the presence of AdV5 hyperimmune bovine sera (dotted histograms) or normal bovine serum (solid histograms) or mock transduced (grey-filled histograms). Plots are representative of cells from six different animals analysed in duplicate.

