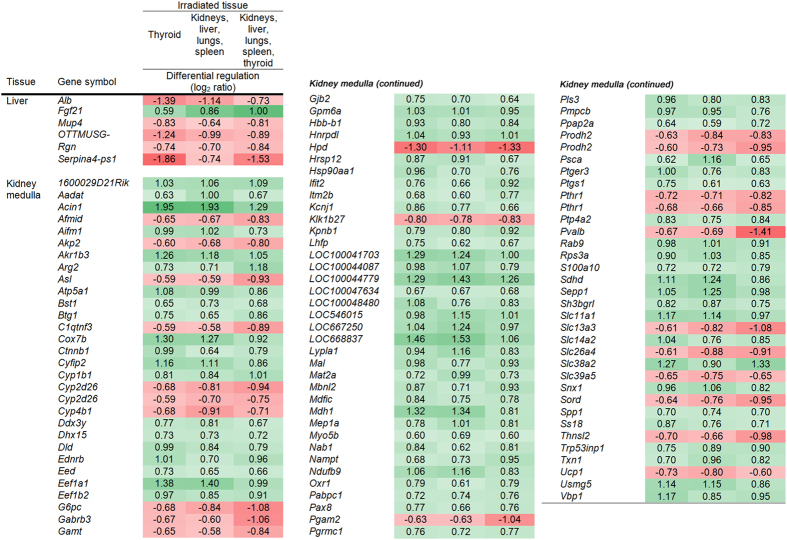
Figure 1. Transcripts regulated at all irradiation setups.
The figure shows the transcripts that were regulated after 24 h across all irradiation setups in the liver and kidney medulla with respective log2 ratios for each irradiation setup (irradiated tissue(s), i.e. groups (A–C). In the kidney cortex, lungs, spleen, and thyroid, no transcripts were continuously regulated across all irradiation setups. Positive numbers indicate upregulation (green), negative numbers indicate downregulation (red).

