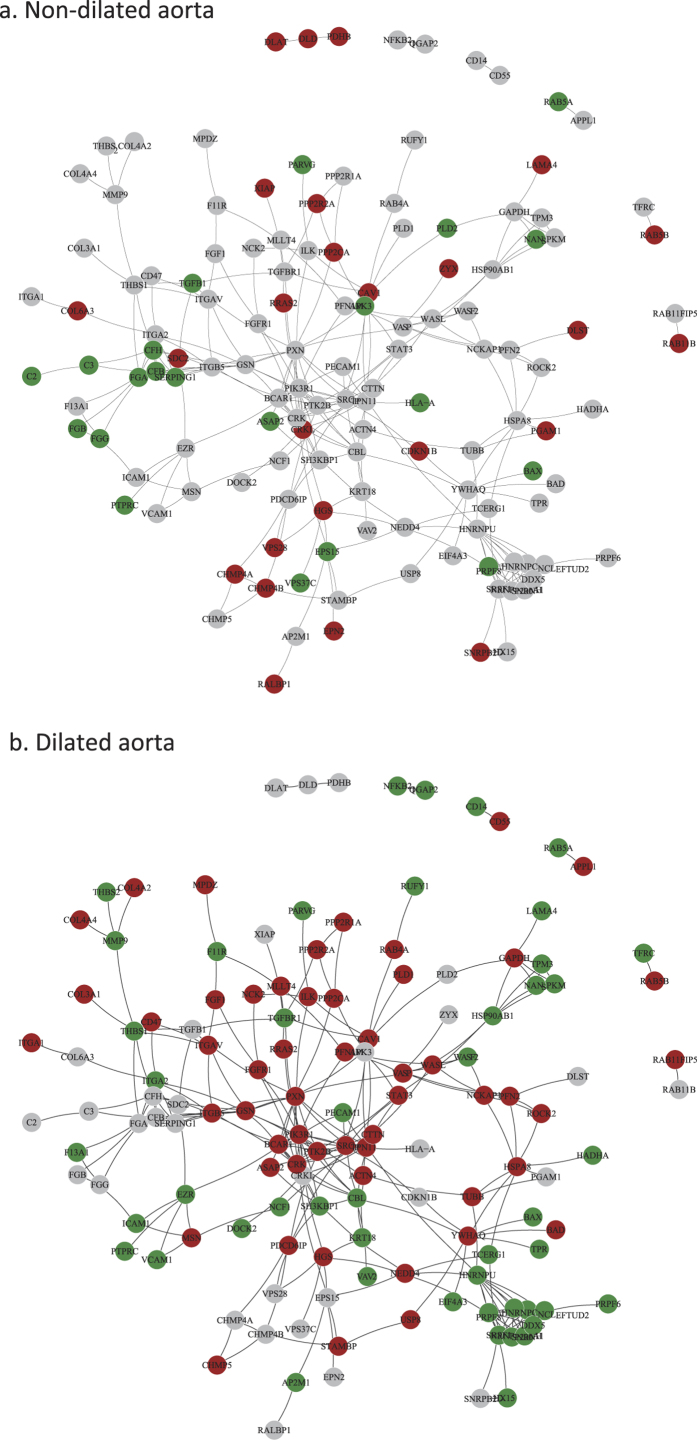
Figure 1. Protein–protein interactions (PPIs) network of proteins involved in enriched KEGG pathways shown in Table S5a,c.
Interactions are retrieved from Human Protein Reference Database (HPRD)46. Proteins are colored according to the direction of expression change in non-dilated samples and dilated samples respectively. Red indicates up-regulated in BAV compared to TAV; Green indicates down-regulated in BAV and grey indicates unchanged.

