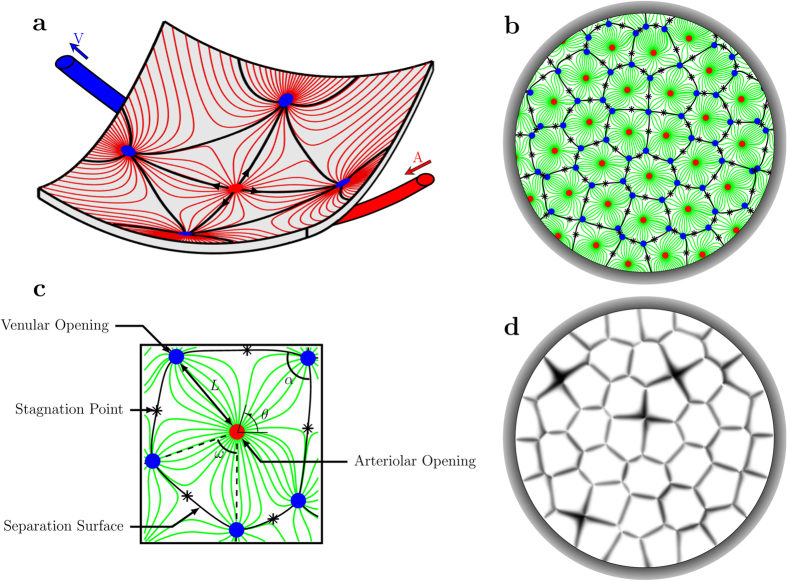
Figure 2. Geometrical segmentation of the choriocapillaris blood flow and its visualisation.
A schematic of the streamline pattern in the mid-plane of the choriocapillaris is shown in (a). Arteriolar and venular openings are represented as respectively red and blue dots. Streamlines of the blood flow in the mid-plane of the choriocapillaris set by a random distribution of arteriolar and venular openings are plotted in (b). The separation surfaces of the flow field, which delineate functional vascular segments, are plotted as a series of connected black lines. Stagnations points are represented as asterisks. An individual functional vascular segment taken from (b) is represented in (c) and parameters of the model are indicated. The number of sides of the functional vascular segment is here  . The vicinity of the separation surfaces takes a comparatively prolonged time to be reached by a passive dye filling the flow domain, as shown in (d) (Video S2). This property may be harnessed to visualise the segmentation of the blood flow.

