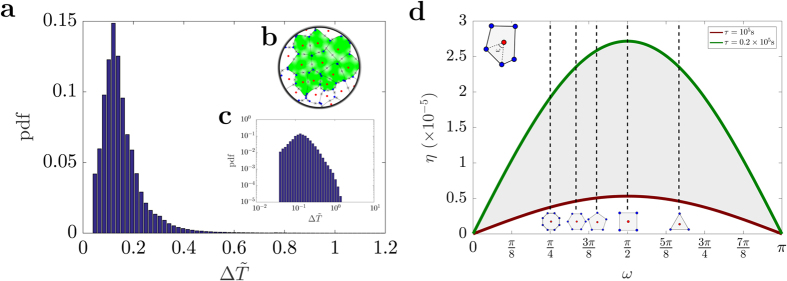
Figure 4. Relation between the shape of functional vascular segments, the corpuscle travel time and mass extraction.
Shown in (a,c) is the probability density function (pdf) of the travel time of a corpuscle (here denoted  ) calculated for ten adjacent functional vascular segments of a randomly generated distribution of arteriolar and venular openings (plotted in (b)). In (d), the evolution of the mass extraction η is plotted as a function of the angle ω between an arteriolar opening and two consecutive venular openings feeding and draining the same functional vascular segment (see Methods). Regular polygons associated with certain angles are indicated. The shaded area corresponds to 0.2 × 10⁵ s ≤ τ ≤ 105 s, which concurs with an extraction rate of between 1 and 5% per volume of blood42,43,44.

