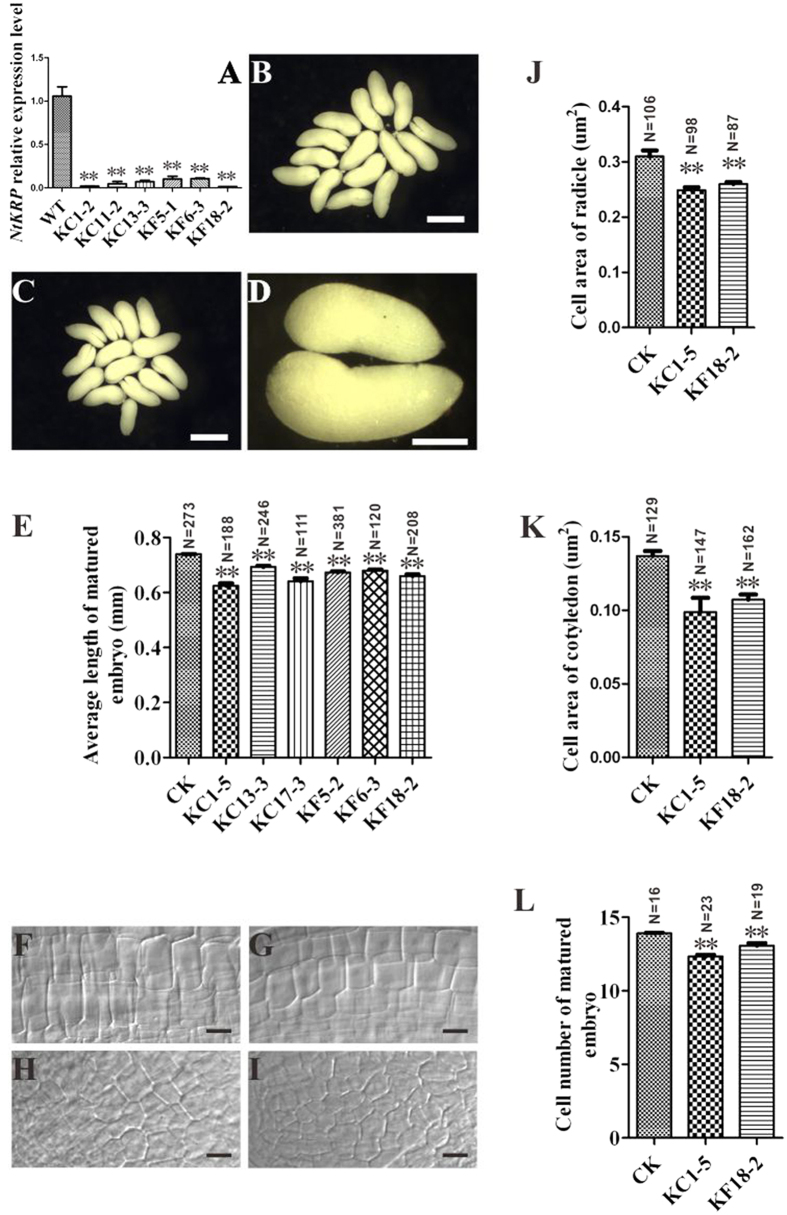
Figure 4. Phenotypic characterization of wild-type and RNAi embryos.
(A) Relative expression levels of NtKRP in RNAi seedlings and wild-type by RT-qPCR. The expression level of NtKRP in the WT was set to 1. **Indicates statistically significant difference compared to WT (t-test, p < 0.01). (B–D) Mature embryos of wild-type (B) and RNAi (C) plants. (D) For comparison, the magnified image shows mature embryos from the RNAi (left) and wild-type (right) plants. (E) Length of mature embryos of wild-type and RNAi plants. Values are the means ± SD (n ≥ 111). (F, G) Longitudinal views of radicle cells in mature embryos of wild-type (F) and RNAi (G) plants. (H,I) Longitudinal views of cotyledon cells in the mature embryos of wild-type (H) and RNAi (I) plants. Cell areas of the radicle (J) and cotyledon (K) of wild-type and RNAi plants. Values are means ± SD (n ≥ 87 and n ≥ 129, respectively). (L) Cell number in the radicles of wild-type and RNAi plants. Values are the means ± SD (n ≥ 16). Scale bars = 500 μm (A,B), 250 μm (C), and 15 μm (E–H).

