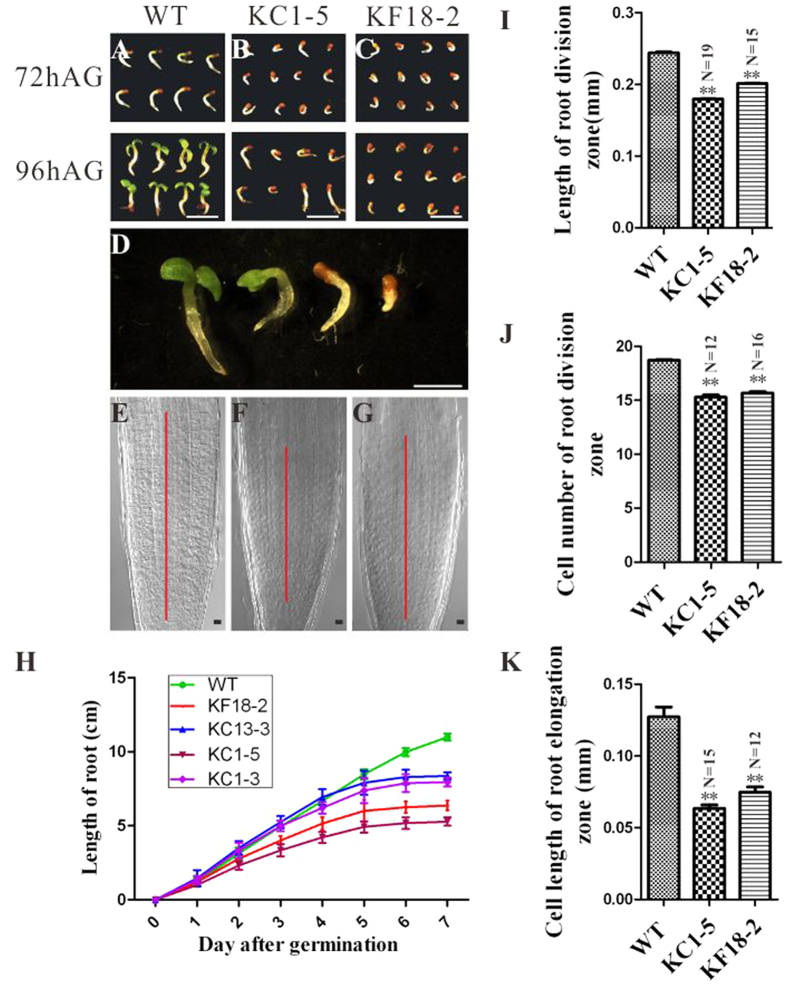
Figure 5. Phenotypic characterization of the roots of wild-type and RNAi plants.
(A–D) Seeds 72 h and 96 h after germination of wild-type plants (A) and KC1-5 (B) and KF18-2 (C) RNAi plants. (D) Magnified images of the seedlings from all three plant types at the same time after germination. (E–G) Root tip of wild-type plants (E) and KC1-5 (F) and KF18-2 (G) RNAi plants. The red lines mark the length of the meristematic zone. (H) Root growth curve of wild-type and RNAi transgenic plants. Values are means ± SD (n ≥ 15). (I) Length of the root meristematic zone of wild-type and RNAi plants. Values are the means ± SD (n ≥ 15). (J) Cell number in the root meristematic zone of wild-type and RNAi plants. Values are means ± SD (n ≥ 12). (K) Cell length in the root elongation zone of wild-type and RNAi plants. Values are the means ± SD (n ≥ 12). Scale bars = 4 mm (A–C), 2 mm (in D), and 20 μm (E–G).

