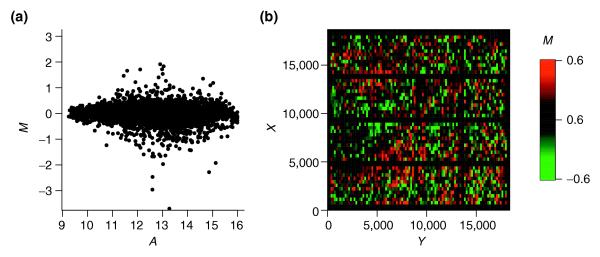
Figure 2.

Intensity and spatial distribution of log ratios for local intensity-dependent normalization (LIN) with default model parameters. (a) The residuals of the local regression are well balanced around zero in the MA-plot. (b) Patterns of spatial bias are still apparent in the MXY-plot, whereas the lines of negative M corresponding to empty spots disappeared as a result of the intensity-dependent normalization.
