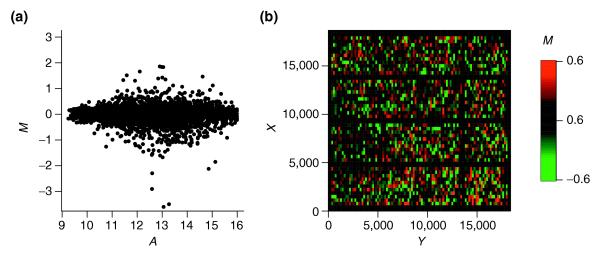
Figure 3.

Intensity and spatial distribution of log ratios for optimized local intensity-dependent normalization. (a) MA-plot; (b) MXY-plot. Both plots indicate no apparent bias for log ratio M with respect to the intensity A or the spot location (X,Y). Note, however, that the MXY-plot shows areas of differing brightness corresponding to areas of differing variability of M. Regions with large abs(M) appear, therefore, brighter than regions with small abs(M). For example, the variance of M seems to be larger around spot location (X = 2,500, Y = 16,000) than round the location (X = 7,000, Y = 3,000).
