Figure 6.

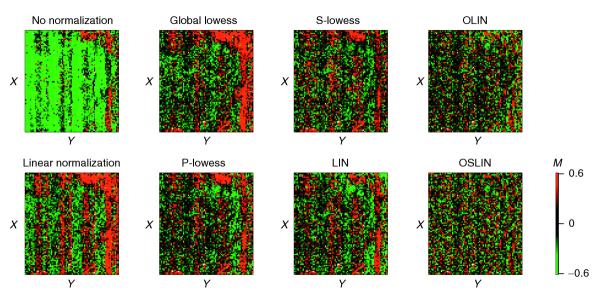
MXY-plots of slide 1 of the apo AI experiment for raw and normalized data. In this case, the X and Y coordinates correspond to rows and columns of the array, as exact spot locations are not given for the publicly available dataset.

MXY-plots of slide 1 of the apo AI experiment for raw and normalized data. In this case, the X and Y coordinates correspond to rows and columns of the array, as exact spot locations are not given for the publicly available dataset.