
Figure 7.
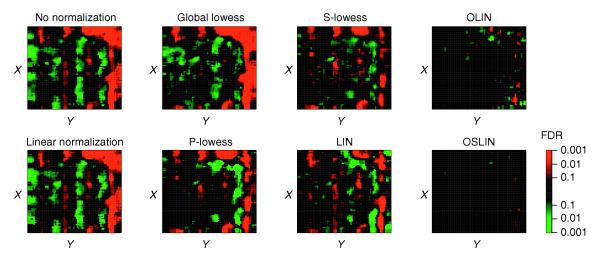
Significance of spatial bias for slide 1 of the apo AI experiment. Spots were represented by red or green squares if their neighborhood had a significant positive or negative median M value, respectively. The level of significance (FDR) is encoded by the brightness of the colors as shown in the color scale.