Figure 8.

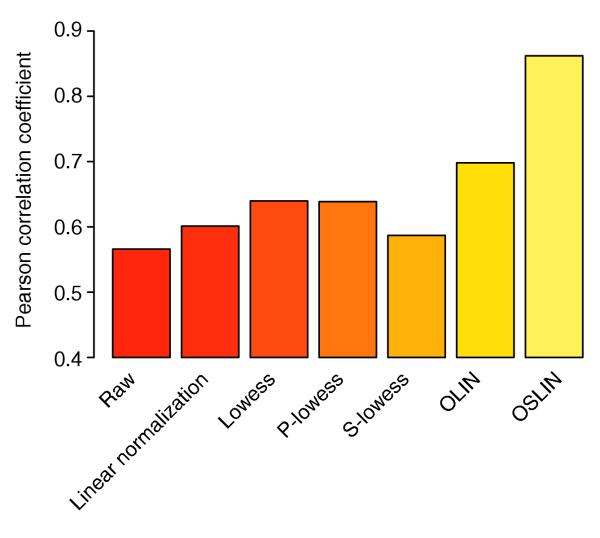
Histogram of Pearson correlation between logged qPCR- and microarray-based fold changes of COX2 expression for the fibroblast microarray experiment of Iyer et al. [24] after application of various normalization methods.

Histogram of Pearson correlation between logged qPCR- and microarray-based fold changes of COX2 expression for the fibroblast microarray experiment of Iyer et al. [24] after application of various normalization methods.