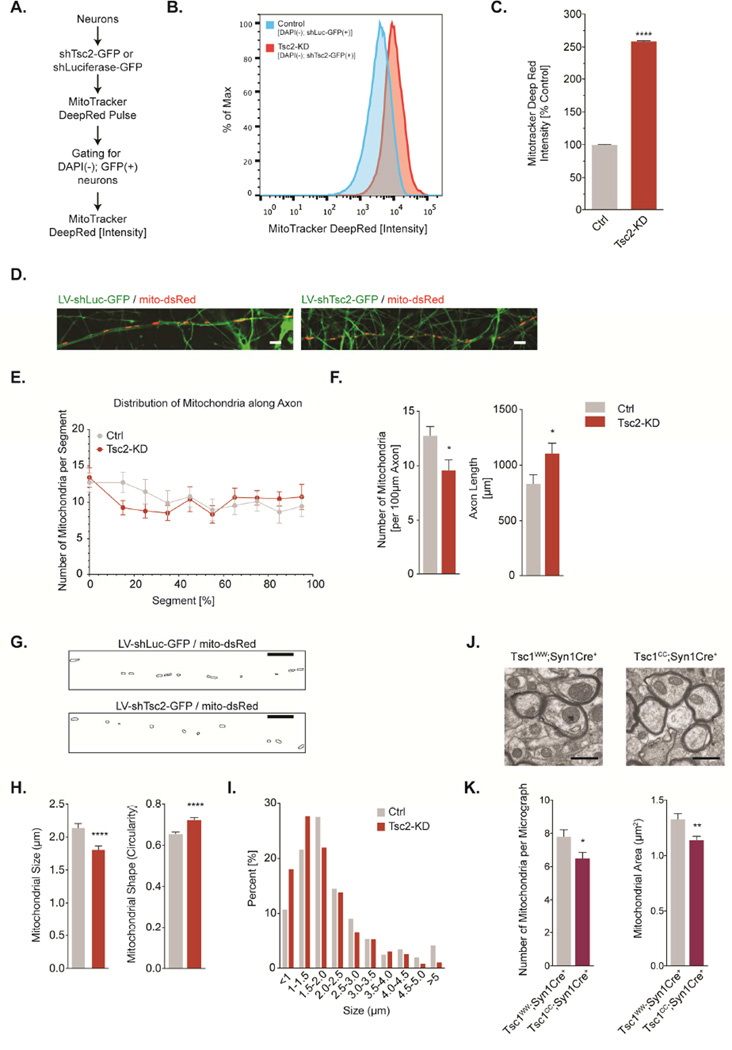
Figure 1. Tsc2-deficient neurons accumulate mitochondria in their cell bodies but are depleted of axonal mitochondria.
(A-C) Flow cytometry-based quantification of mitochondrial content using MitoTracker Deep Red in cortical neurons (DIV11). Note that this assay primarily quantifies the mitochondrial content in cell bodies since neurites may be lost during sample preparation (n=9×10⁶ recorded events per condition from 9 independent samples).
(D) Live cell confocal imaging of individual mitochondria in single axons of hippocampal neurons transduced with shLuc-GFP or shTsc2-GFP (DIV7/8). Scale bar, 5 µm
(E) Distribution of mitochondria along the full length of axons in hippocampal neurons (DIV7/8, n=40 axons per condition from 8–10 experiments).
(F) Number of mitochondria per 100 µm of axon and the average length of axons in hippocampal neurons (DIV7/8, n=40 axons per condition from 8–10 experiments).
(G-I) Quantitative assessment of mitochondrial morphology (circularity and Feret’s diameter) in axons of hippocampal neurons (DIV7/8, n>400 mitochondria per condition from 8–10 experiments). Scale bar, 10 µm
(J&K) Transmission electron microscopy of callosal projection axons from Tsc1CC;Syn1Cre+ (n=2) and Tsc1WW;Syn1Cre+ littermates (n=3). Graphs show the number of mitochondria per micrograph and the average mitochondrial area (n>450 mitochondria per condition). Scale bar, 1 µm
Luc= Luciferase; *p<0.05, **p<0.01, ***p<0.001, ****<p.0001. See also Figure S1.

