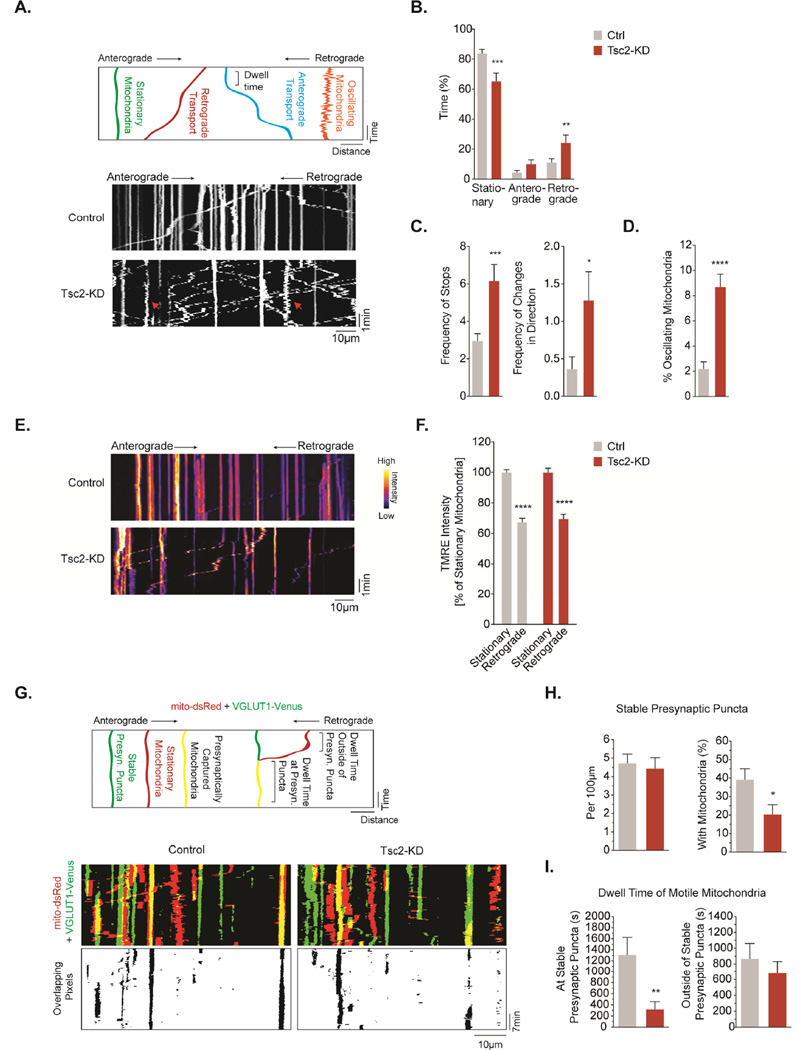
Figure 3. Axonal mitochondria in Tsc2-deficient neurons are shuttled to the cell body and presynaptic capturing of mitochondria is impaired.
(A) Mitochondrial transport quantified through a standardized live cell microscopy assay (see Fig. S3A).
(B&C) Mitochondrial transport in the mid axon of hippocampal neurons (DIV7/8). Graph shows the time that mitochondria spend in a stationary position, or moving in the retrograde or anterograde direction. The frequency of stops and changes in direction per 5min recording is calculated (n>25 axons per condition from 5–8 experiments).
(D) Percentage of axonal mitochondria with an oscillating movement pattern (n>25 axons per condition from 5–8 experiments).
(E&F) TMRE staining in stationary mitochondria vs. mitochondria transported in the retrograde direction (n>10 axons per condition from 3 experiments).
(G) Quantitative assessment of mitochondrial capturing at presynaptic sites and representative examples (DIV7/8).
(H) Number of stable presynaptic puncta per 100 µm axon and the percentage of stable presynaptic puncta supported by stationary mitochondria in hippocampal neurons (DIV7/8, n=14 axons per condition from 7 experiments).
(I) Average dwell time of motile mitochondria at and outside of stable presynaptic puncta in hippocampal neurons (DIV7/8, n=14 axons per condition from 7 experiments).
*p<0.05, **p<0.01, ***p<0.001, ****<p.0001. See also Figure S3.

