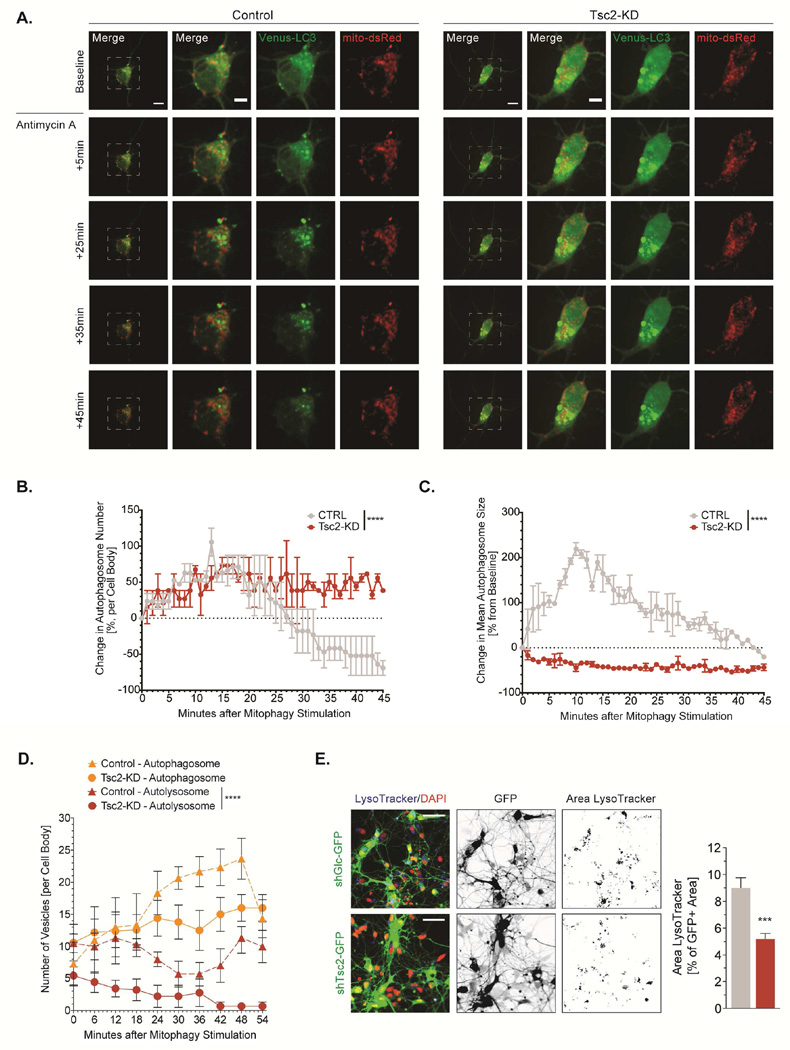
Figure 6. Deficits in the lysosome-dependent stages of mitophagy in Tsc2-deficient neurons.
(A-C) Autophagosome turnover in hippocampal neurons (DIV7/8) acutely treated with antimycin A (40 µM). Graphs show the percent change in autophagosome number and size from baseline (n= 3 experiments). Scale bar, 10 µm, 5 µm (inset)
(D) Autophagosomes (GFP+ and mCherry+) and autolysosomes (RFP+only) in hippocampal neurons (DIV7/8) transfected with mCherry-EGFP-LC3 and acutely treated with antimycin A (40 µM, (n=4 experiments)).
(E) LysoTracker Deep Red stained lysosomes in hippocampal neurons (DIV7/8). Graph shows the lysosomal area as a percentage of the GFP stained cell area (n>25×103 cells per condition from 3 experiments). Scale bar, 40 µm
***p<0.001, ****<p.0001. See also Figure S5.

