Fig. 4.

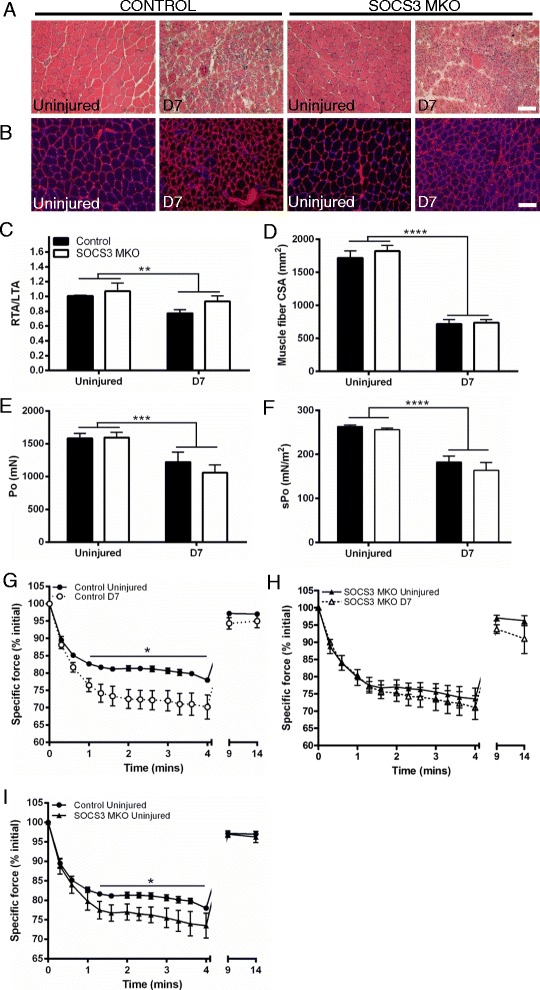
Skeletal muscle fiber-specific deletion of SOCS3 does not alter force production of the TA muscles. Control (SOCS3fl/fl MCK-Cre−) and SOCS3 MKO (SOCS3fl/fl MCK-Cre+) mice were either left uninjured (UN) or received a single 40 μL injection of notexin (10 μg/ml) into the right TA muscle. Representative hematoxylin and eosin (a) and laminin and DAPI (b) stained sections of TA muscle from uninjured or day 7 injured control and SOCS3 MKO mice. Muscle mass relative to the uninjured left TA muscle (c), muscle fiber size (d), maximum isometric force (e), and specific (normalized) force (f) were determined at day 7 post-notexin injury. Data are expressed as mean ± SEM. Statistical analysis was performed using a two-way ANOVA with a Fisher’s LSD post hoc multiple comparisons test to determine effects of genotype and time. n = 8 mice/time-point/genotype. **P < 0.01, ***P < 0.001, ****P < 0.0001 compared to uninjured muscle. Specific force production during a 4-min fatiguing protocol comparing uninjured and day 7 injured right TA muscles from control mice (g), SOCS3 MKO mice (h), and comparing uninjured control and SOCS3 MKO mice separately (i). Data are expressed as mean ± SEM. Statistical analysis was performed using a repeated measures two-way ANOVA with a Fisher’s LSD post hoc multiple comparisons test to determine effects of genotype and time. n = 8 mice/time-point/genotype. *P < 0.05 compared to uninjured muscle from control mice. Scale bar = 50 μm
