
Fig. 11.
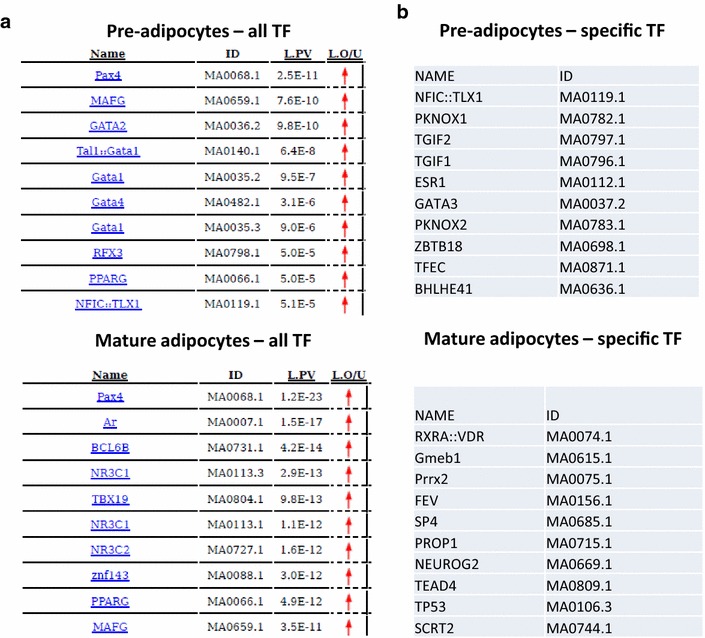
a Tables representing the enrichment for binding sites of known transcription factors (TF) in macroH2A1.2-binding regions in pre-adipocytes (left) and mature adipocytes (right). In each table, the left column contains gene names, the middle column indicates the matrixes generated through PscanChIP and the right column contains the p value. b Tables illustrating the TF-binding sites, best hits among the first one hundred, not in common, e.g., specifically enriched in pre-adipocytes or in mature adipocytes