
Fig. 4.
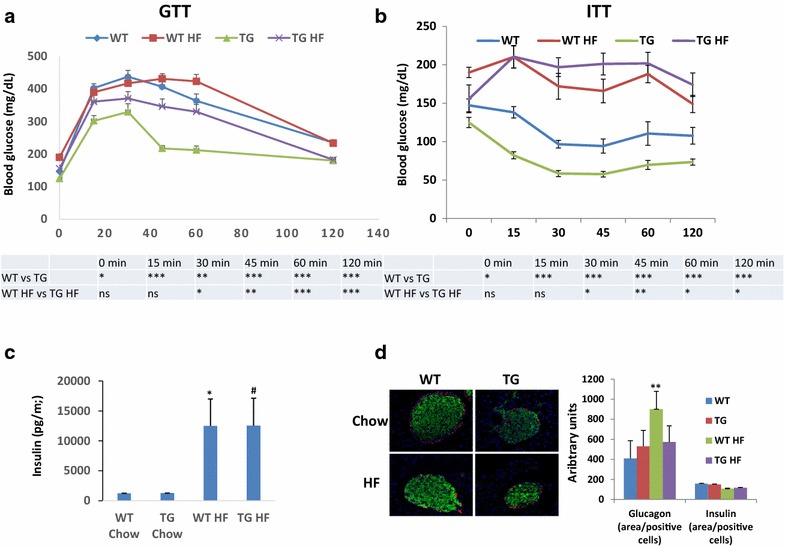
Responsiveness to glucose and insulin and pancreatic islets morphology in macroH2A1.2 Tg mice (Tg). a, b GTT and ITT were performed in WT and Tg mice fed a chow or a HFD following a 6 h fast. Mice were injected with 2 g glucose/kg of body weight intraperitoneally, and blood glucose concentrations were measured at the indicated time points. c Insulin blood levels, measured by ELISA (Milliplex) in the four mice groups upon killing. d Left panels: merged representative example of immunofluorescence staining for insulin (green), glucagon (red) and DAPI (4′,6-diamidino-2-phenylindole; blue), in control islets and macroH2A1.2 Tg mice upon HF diet; right panel: imaging-assisted quantification of glucagon and insulin content, expressed as the ratio area/positive cells. c, d Data are expressed as mean ± S.E.M. (n = 8–9 per group). *p < 0.05, **p < 0.01 macroH2A1.2 Tg versus WT. # p < 0.05 macroH2A1.2 Tg HF versus chow diet