
Fig. 5.
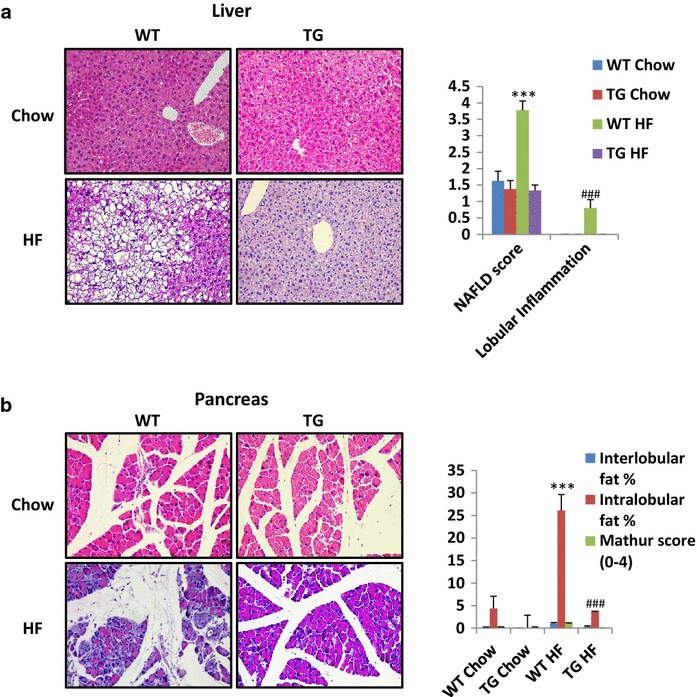
Liver and pancreas histological analyses. a Left: representative pictures from hematoxylin and eosin staining of liver sections around the lobular areas in wild-type and macroH2A1.2 Tg mice fed with a HF diet. Right: NAFLD and inflammation were scored using a semiquantitative system that grouped histological features into broad categories (steatosis, hepatocellular injury, portal inflammation, fibrosis and miscellaneous features) [48]. b Left representative pictures from hematoxylin and eosin staining of pancreatic sections in wild-type and macroH2A1.2 Tg mice fed with a HF diet. Right an evaluation of interlobular and intralobular fat % in pancreas sections was performed, and combined into a Mathur score [49]