
Fig. 8.
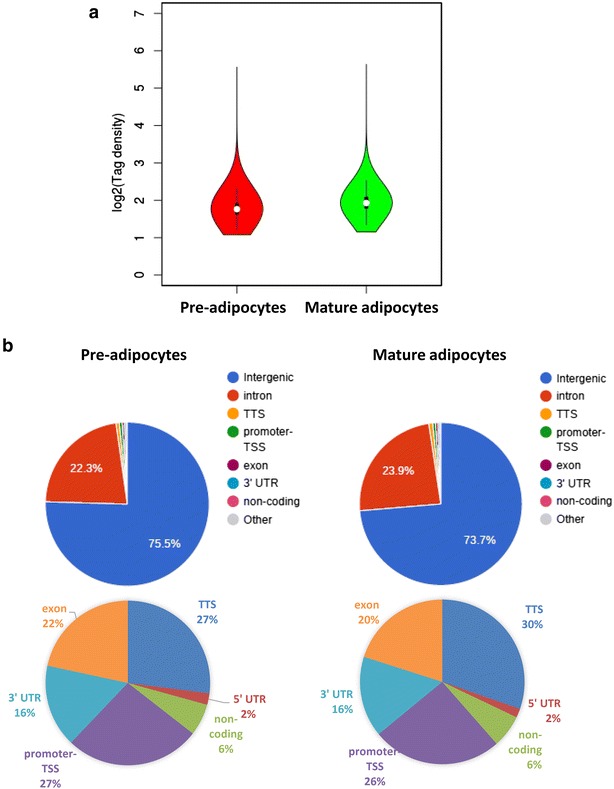
a Violin plots representing the density of reads pre- and post-adipogenic differentiation (pre-adipocytes and mature adipocytes, respectively), calculated with the formula: tag density = count/region length × 100 as log2 values. b Pie charts with annotation of the genomic regions displaying significant binding sites for macroH2A1 in pre-adipocytes and in mature adipocytes. TTS transcription termination site; TSS transcription starting site; 3′UTR 3′ untraslated region. Most of the macroH2A1.2 occupancy is intergenic or in introns (upper pies): lower pies include only the unrepresented genomic binding patterns of macroH2A1.2 (TTS, promoter-TSS, 5′UTR, 3′UTR, noncoding)