
Fig. 9.
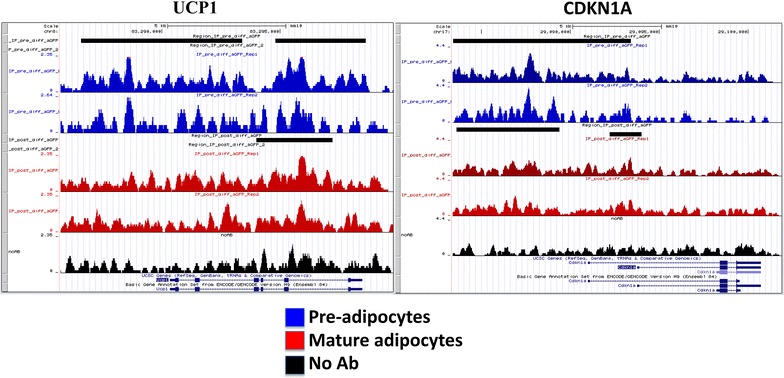
Genome browser (University of California Santa Cruz, UCSC) graphic representation of UCP1 and CDKN1A genes. Bigwigs in blue and red indicate peak distributions—reflecting macroH2A1.2 binding—in 3T3-L1 pre-adipocytes and in 3T3-L1 mature adipocytes, respectively, in biological duplicates. Bigwigs in black indicate aspecific peak distribution [no antibody (Ab), negative control]. Black bars indicate enriched regions (binding sites) with a false discovery rate (FDR) <0.01