
Fig. 7.
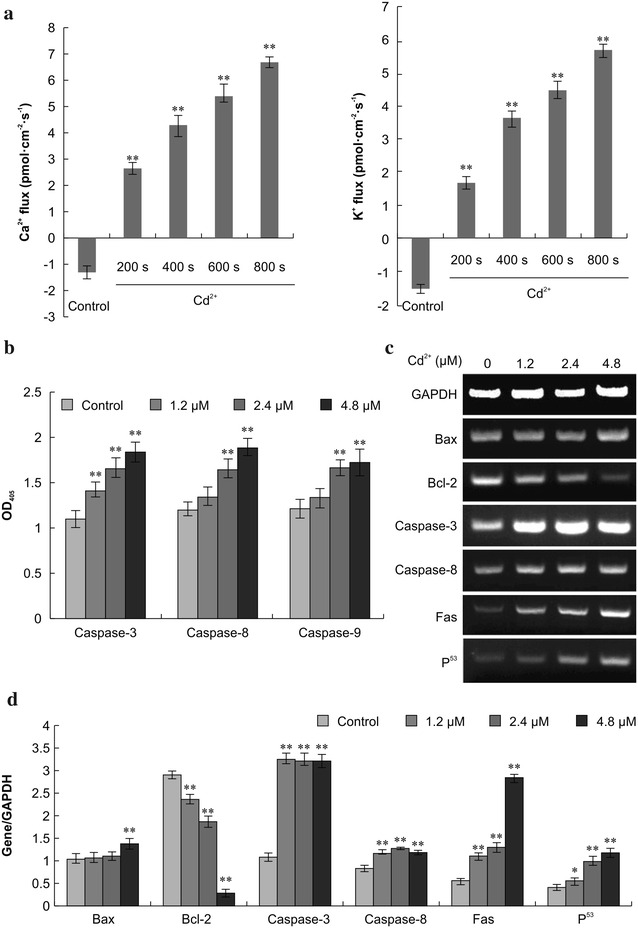
Calcium (Ca2+) and potassium (K+) flux, caspase activity, and gene expression. a Ca2+ and K+ flux was measured before and after treatment of Siberian tiger fibroblasts with 4.8 μM Cd2+ by using the ion flux estimate technique. Statistically significant differences compared to the corresponding controls are denoted by an asterisk (P < 0.05) and a double asterisk (P < 0.01; n = 3). b Activities of caspase-3, -8, and -9 were determined in cytosolic extracts of Siberian tiger fibroblasts. c, d Expression levels of the indicated mRNAs were determined via reverse transcription-polymerase chain reaction 24 h after exposure to Cd2+ and normalized to glyceraldehyde-3-phosphate dehydrogenase mRNA levels