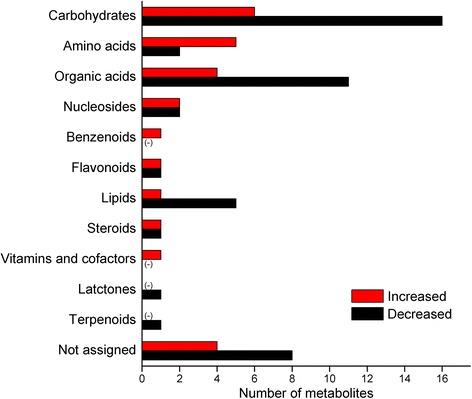
Fig. 3.

Metabolic distribution of metabolites identified in Clematis terniflora DC. leaves. C. terniflora leaves were collected pre- and post-treatment with high level of UV-B irradiation for 5 h followed by the dark for 36 h. Metabolites were extracted using 75 % methanol and analyzed using GC-TOF-MS. Metabolites were functionally categorized using the KEGG database or manually classified based on their chemical structures. Numbers of categorized metabolites are shown in the graph. Red bars indicate increased metabolites post-treatment compared with pre-treatment, and black bars indicate decreased
