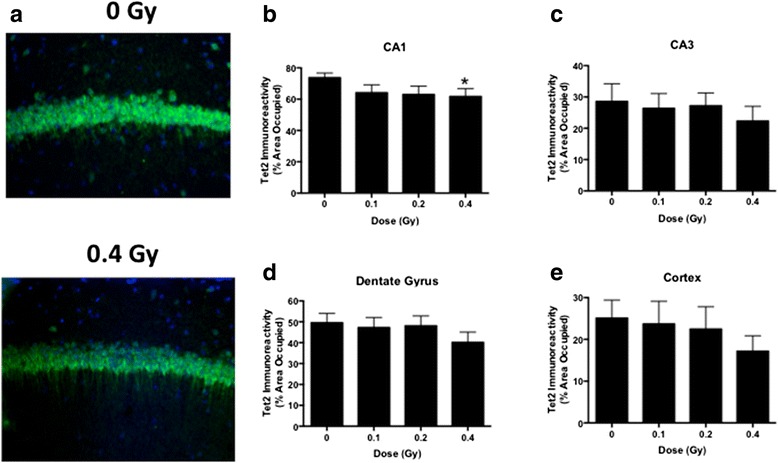
Fig. 10.

Tet2 immunoreactivity two weeks following sham or 56Fe-irradiation. a Representative images of Tet2 immunoreactivity in the CA1 region of the hippocampus of a sham-irradiated mouse and a mouse irradiated with 0.4 Gy. b Tet2 immunoreactivity levels in the CA1 region of the hippocampus. *p < 0.05 versus sham-irradiation. c Tet2 immunoreactivity levels in the CA3 region of the hippocampus. d Tet2 immunoreactivity levels in the dentate gyrus. e Tet2 immunoreactivity levels in the CA1 region of the cortex. N = 21 mice/dose. Scale bar: 100 μm
