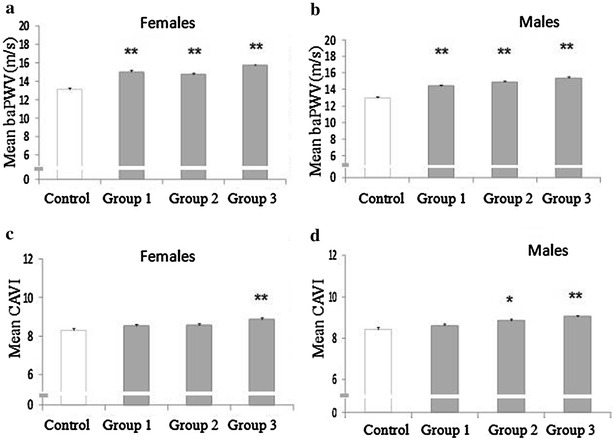
Fig. 3.

Impact of the specific groups of MetS components on brachial-ankle pulse wave velocity (baPWV) and cardio-ankle vascular index (CAVI) in the different groups. a Impact of the group in females on baPWV. b Impact of the group in males on baPWV. c Impact of the group in females on CAVI. d Impact of the group in males on CAVI. Data are given as mean ± standard error. baPWV and CAVI levels were compared using an ANOVA test, followed by post hoc analysis using a Bonferroni test. **p < 0.01 between the different groups and control; *p < 0.05 between the different groups and control. Group 1 Group MetS-mixed; Group 2 MetS-dyslipidemia; Group 3 Group MetS-increased insulin resistance; Group Control A group of 175 subjects without MetS, arterial hypertension, FPG or use of antihypertensive, lipid-lowering or antidiabetic drugs was used as control. baPWV brachial-ankle pulse wave velocity, CAVI cardio-ankle vascular index, MetS metabolic syndrome, FPG fasting plasma glucose
