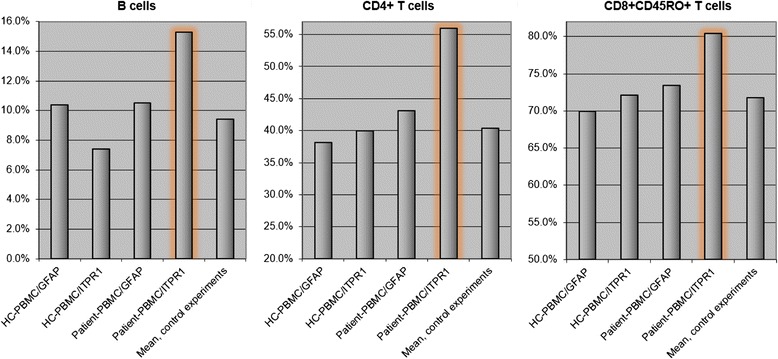
Fig. 5.

Increase in the proportion of B cells, CD4+ T cells and CD8+CD45RO+ T cells among PBMCs from patient 1 (2 × 10⁵ cells) following stimulation with ITPR1 (10 μg/ml) (orange outlines) compared with stimulation with GFAP (10 μg/ml) and compared with healthy donor PBMCs stimulated with the same amount of ITPR1 or GFAP, respectively
