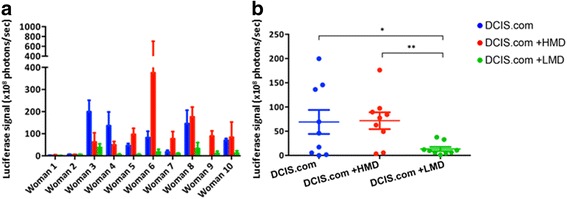
Fig. 3.

Analyses of chamber explant luciferase signalling. a Luciferase signal measured in the chambers at explant (×108 photons per second) for each of the ten women. b Average values for each woman are shown as scatterplots after removal of a significant outlier (patient 6). HMD High mammographic density, LMD Low mammographic density, DCIS MCF10DCIS.com cells. *P = 0.03; **P = 0.005. All bar and scatterplot graphs represent mean ± SEM
