
Fig. 5.
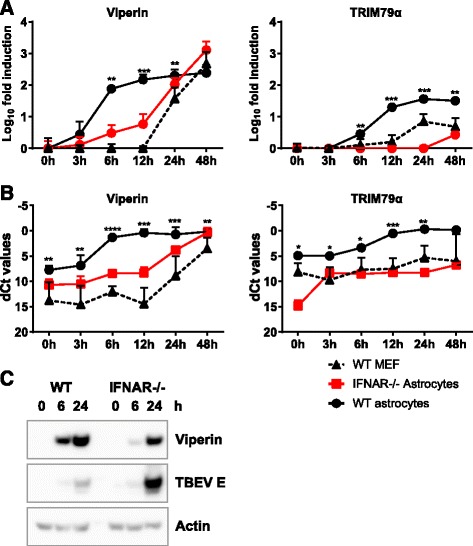
Astrocytes express higher baseline levels and upregulate ISGs faster after TBEV infection compared to MEFs. Primary astrocytes (WT and IFNAR−/−) and MEFs were infected with TBEV MOI 0.1, and total cell RNA was extracted at indicated times post infection. Expression levels of viperin and TRIM79α (a, b) were measured by qPCR analysis, normalized to the cellular GAPDH mRNA. Fold induction over mock (a) and dCT values (b) are depicted. Mean values and standard deviations from three independent experiments performed in triplicates are shown (n = 9). Asterisk indicates the significance level between WT astrocytes and MEF. *p < 0.05, **p < 0.01, ***p < 0.001. Protein levels of viperin, TBEV, and actin was detected in TBEV-infected WT and IFNAR−/− astrocytes over time (c)