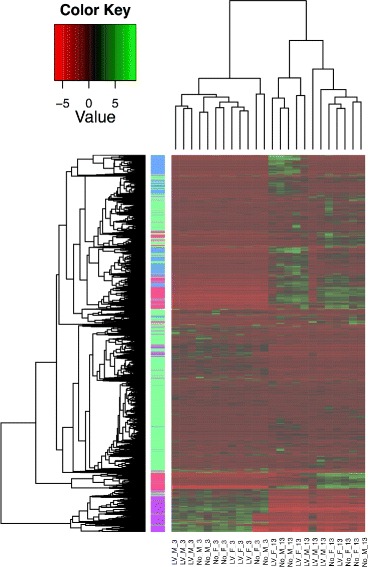
Fig. 2.

A heatmap showing the differential gene expression and clustering of samples according to expression values. The samples are on the left axis with notation for the treatments (LV = Low-Variable calling treatment; No = Silent Treatment), Sex (F = Female; M = Male), and age (3 = 3 Days; 13 = 13 Days). The top axis is the gene relationships, and the right axis is the clustering of the samples
