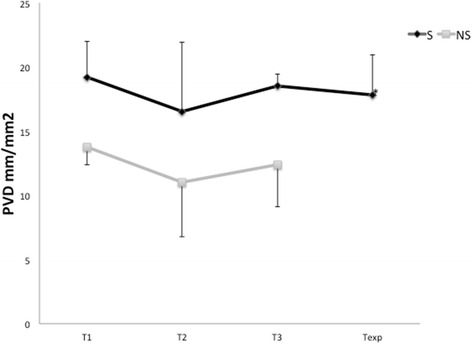
Fig. 2.

Example of change in the perfused vessel density (PVD) parameters in the survivor (S) and non-survivor (NS) groups at the following time points: initiation of the VA-ECMO insertion (T1), 48–72 h after VA-ECMO initiation (T2), 5–6 days after VA-ECMO initiation (T3), and after VA-ECMO explantation (Texp). The medians are depicted
