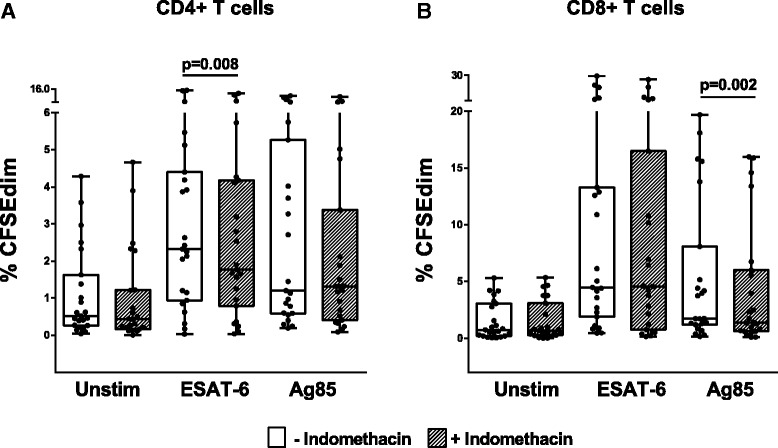
Fig. 6.

Effect of Indomethacin on CD4+ and CD8+ T cell proliferation. Proliferative responses measured by percentages of CFSEdim in unstimulated, ESAT-6 and Ag85 stimulated PBMCs without (open boxes) and with (hatched boxes) indomethacin after 6 days stimulation. PBMCs were obtained from patients with active TB prior to treatment. a CD4+ T cells (n = 23). b CD8+ T cells (n = 23). P- values were calculated by Wilcoxon matched pairs test. Plots are shown as box plots with individual data points with median, IQR and minimum/maximum values. Significant changes between stimulated samples with and without indomethacin are denoted with p-values in figure. %CFSEdim cells were significantly upregulated upon stimulation with both E6 and Ag85 (p < 0.001, values not shown in figure)
