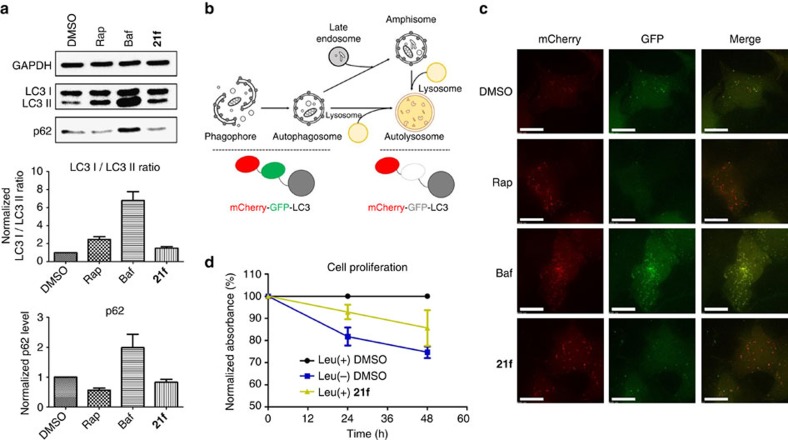
Figure 6. Autophagic activation of 21f and its reduction on cell proliferation.
(a) Western blot analysis of LC3 and p62. HeLa cells were treated with 200 nM of rapamycin (Rap), 10 nM of bafilomycin A1 (Baf) or 20 μM of 21f for 6 h. Quantification of relative band intensity of LC3 I/LC3 II ratio and p62 expression level were normalized with DMSO sample. Data from at least three independent experiments were normalized; error bars represent the s.d. (b) Schematic depiction of mCherry-GFP-LC3 system. The pH decreases with lysosome fusion to autophagosome, thereby quenching GFP fluorescence while mCherry fluorescence is maintained. (c) mCherry and GFP fluorescence images. HeLa cells were transfected with mCherry-GFP-LC3 plasmid and treated with 200 nM of Rap, 10 nM of Baf or 20 μM of 21f for 6 h. Scale bar, 15 μm. (d) Normalized cellular proliferation level in HEK293T cells was measured by colorimetric BrdU assay under the Leu-deprived media or under the normal media in the absence and presence of 21f (5 μM). Error bars represent the s.e.m.

